Por el momento, esta página sólo está disponible en inglés.
 / 
Prometheus Remote Write integration

Prometheus Remote Write integration

Prometheus' ability to monitor a wide variety of data necessitates monitoring the toolkit itself. New Relic helps store, manage, and view telemetry data from your Prometheus setup, relieving you of a significant operational burden.

What's included?

dashboards
1
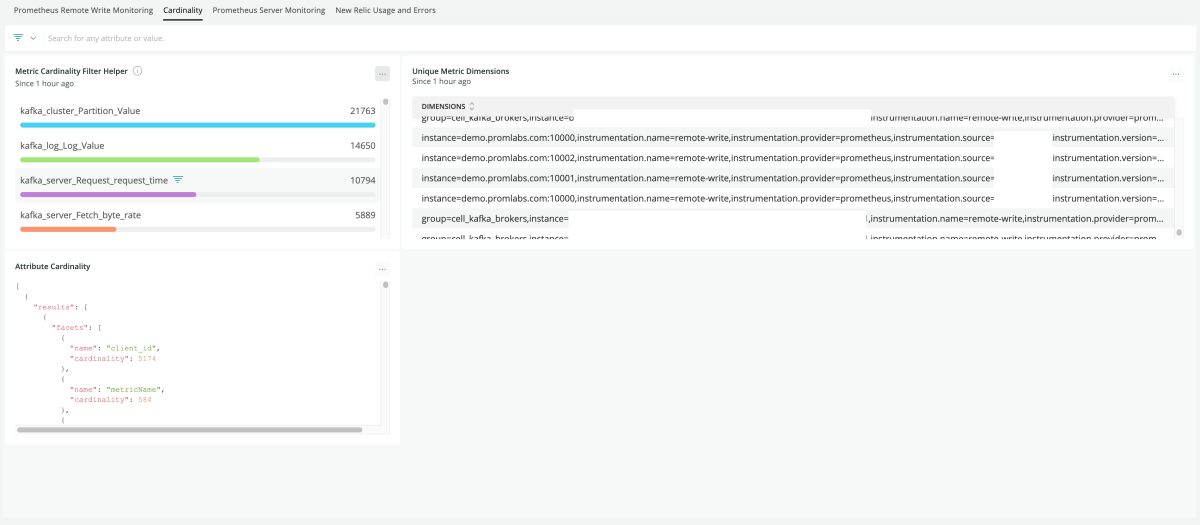
Prometheus Remote Write integration quickstart contains 1 dashboard. These interactive visualizations let you easily explore your data, understand context, and resolve problems faster.
documentation
1
Prometheus Remote Write integration observability quickstart contains 1 documentation reference. This is how you'll get your data into New Relic.
alerts
0
This quickstart doesn't include any alerts. Do you think it should?
You can edit this quickstart to add helpful components. View the repository and open a pull request.
View repo View repo

Prometheus monitoring

Prometheus is an open-source monitoring and alerting toolkit. Setting up Prometheus is straightforward, but scaling up and managing is not. That’s where New Relic steps in.

New Relic's Prometheus quickstart

New Relic offers two Prometheus integration schemes, Remote Write and OpenMetrics.

Remote Write is ideal for well-established Prometheus infrastructures. It provides easy access to your metrics and only takes one line of yaml in your configuration for access.

OpenMetrics allows for more visibility across multiple container platforms. Once the integration is set up, you can query data on memory usage for pods in deployment, facet any metrics, and view raw metric values all in one place.

New Relic's Prometheus Integration stores various kinds of telemetry data - whether open-source, vendor-specific, or vendor-agnostic.

Value of the Prometheus quickstart

This New Relic quickstart helps you to configure Prometheus Remote Write.

Remote Write:

See all of your metrics in one place

  • Combine and group all data across an entire software stack
  • Connect Grafana dashboards
  • Better understand the relationship between data and behaviors related to your software stack

How to use this quickstart

  • Sign Up for a free New Relic account or Log In to your existing account.
  • Click the install button.
  • Install the quickstart to get started or improve how you monitor your environment. They're filled with pre-built resources like dashboards, instrumentation, and alerts.
Authors
New Relic
Support
BUILT BY NEW RELIC
Need help? Visit our Support Center or check out our community forum, the Explorers Hub.