Quickstart
Integration Features
Dashboards
Alerts
Documentation
dashboards
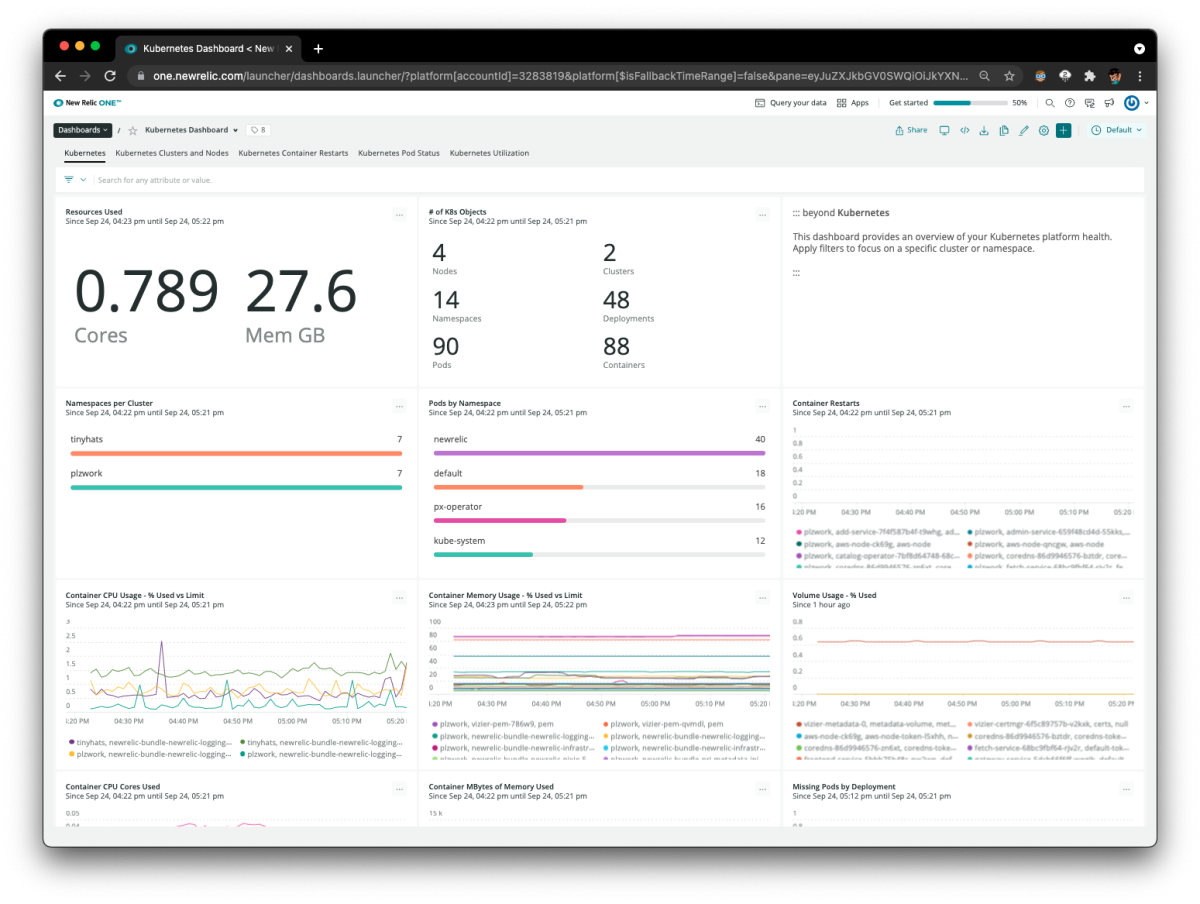
Kubernetes quickstart contains 1 dashboard. These interactive visualizations let you easily explore your data, understand context, and resolve problems faster.
Show MoreShow Less
Kubernetes Dashboard
See all
alerts
Kubernetes observability quickstart contains 23 alerts. These alerts detect changes in key performance metrics. Integrate these alerts with your favorite tools (like Slack, PagerDuty, etc.) and New Relic will let you know when something needs your attention.
Show MoreShow Less
1. Container is Waiting
Alert when a container is Waiting for more than 5 minutes
2. Etcd has no leader
Alert when Etcd has no leader for more than 1 minute
3. Container cpu throttling is high
Alert when container is being throttled > 25% of the time for more than 5 minutes
4. Job Failed
Alert when a Job reports a failed status
5. Node allocatable cpu utilization is high
Alert when the average Node allocatable cpu utilization is > 90% for more than 5 minutes
6. Container high memory utilization
Alert when the average container memory utilization (vs. Limit) is > 90% for more than 5 minutes
7. Etcd file descriptor utilization is high
Alert when Etcd file descriptor utilization is > 90% for more than 5 minutes
8. HPA current replicas < desired replicas
Alert when a Horizontal Pod Autoscaler's current replicas < desired replicas for > 5 minutes
9. Container is Restarting
Alert when the container restart count is greater than 0 in a sliding 5 minute window
10. Deployment is missing Pods
Alert when Deployment is missing Pods for > 5 minutes
11. Node root file system capacity utilization is high
Alert when the average Node root file system capacity utilization is > 90% for more than 5 minutes
12. Daemonset is missing Pods
Alert when Daemonset is missing Pods for > 5 minutes
13. Node allocatable memory utilization is high
Alert when the average Node allocatable memory utilization is > 90% for more than 5 minutes
14. Container high cpu utilization
Alert when the average container cpu utilization (vs. Limit) is > 90% for more than 5 minutes
15. Node is not ready
Alert when a Node is not ready for > 5 minutes
16. HPA has reached maximum replicas
Alert when a Horizontal Pod Autoscaler has reached its maximum replicas for > 5
17. Pod cannot be scheduled
Alert when a Pod cannot be scheduled for more than 5 minutes
18. Persistent Volume has errors
Alert when Persistent Volume is in a Failed or Pending state for more than 5 minutes
19. Node Pod count nearing capacity
Alert when the Running pod count on a Node is > 90% of the Node's Pod Capacity for more than 5 minutes
20. Node is unschedulable
Alert when Node has been marked as unschedulable
21. Statefulset is missing Pods
Alert when Statefulset is missing Pods for > 5 minutes
22. More than 5 pods failing in namespace
AAlert when more than 5 pods are failing in a namespace for more than 5 minutes
23. Pod is not ready
Alert when a Pod is not ready for > 5 minutes
documentation
Kubernetes observability quickstart contains 1 documentation reference. This is how you'll get your data into New Relic.
Show MoreShow Less

