Quickstart
Complete quickstart for HAProxy monitoring
HAProxy monitoring helps maintain system performance and provides the visibility you need to identify and resolve the cause of errors and latency. When you monitor HAProxy in real-time, you can see the entire service topology of your data pipeline and applications in an HAProxy dashboard.
Keep track of TCP and HTTP-based applications powered by the highly available and stable TCP/HTTP load-balancing software and proxy solution.
New Relic HAProxy quickstart highlights
New Relic's HAProxy monitoring agent tracks server capacity to ensure that it can handle all concurrent sessions. You can efficiently manage your resources and run applications optimally by keeping an eye on real-time HAProxy status and statistics.
New Relic's HAProxy monitoring quickstart has the following out-of-the-box features so you can monitor your frontend/server inventory and the health/availability of your backend servers:
- Alerts (latency and errors)
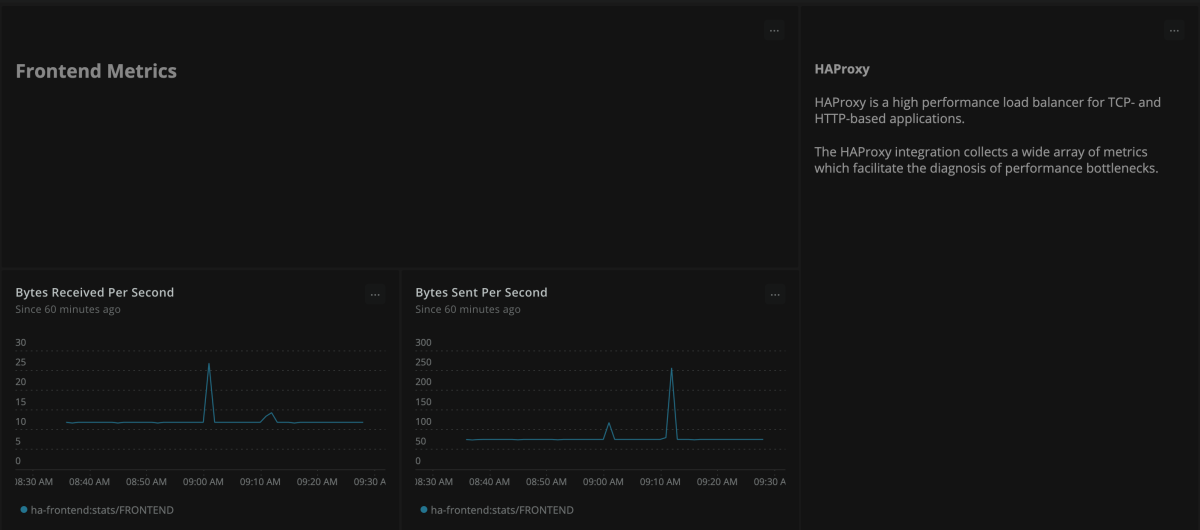
- Dashboards (bytes sent and received per second, frontend statuses, request errors per second, sessions per second, and active servers - same dashboards for both front and backend)
New Relic - The complete HAProxy dashboard tool
New Relic's instant observability quickstart provides a complete view of server health, capacity, and potential latency issues in a single HAProxy dashboard. Track frontend request rates in real-time, gauge the peaks and the drops, and better manage traffic spikes. Get a comprehensive view of the entire infrastructure to remediate errors before impact on user experiences by correlating frontend and backend metrics.
Need help? Visit our Support Center or check out our community forum, the Explorers Hub.


