Metadata is ubiquitous to information technology. The first description of "meta data" for computer systems is purportedly noted by MIT's David Griffel and Stuart McIntosh in 1967. Initially, the main purpose of metadata was to find the physical location of data from punch cards and tapes on a shelf and, later, on disk drives and folders as digital technology progressed. In a nearly boundless telemetry database the physical location of things tends to be less important to the user although we can consider things like account IDs and named environments (for example, QA, DEV, Prod) as logical proxies for physical organization.
At its core, telemetry data is really just a series of numbers. Some represent counts, some magnitudes, and sometimes a qualitative string that denotes a condition like OK, PASS, FAIL. Some values are higher than they were an hour ago and some lower. That's the nature of time series data of which New Relic is mainly constituted. Without some ability to analyze telemetry data by comparing and contrasting like or unlike groups, our ability to make informed data-driven decisions is almost non-existent. At the very top-most level all of New Relic’s standard agents will at least group telemetry under a common application name and ID. That is necessary but not sufficient for modern observability. This blog explains how metadata is useful, how metadata can be managed in New Relic and what a simple standard for entity metadata may look like.
Why we need metadata
At the highest level metadata will help you:
- Find entities and telemetry when you know the characteristics of interest but may not know all of the associated entities or records (or they are too numerous to analyze as one large set).
- Visualize entities and telemetry by characteristics of interest. Helps see the relative size of the groups and visualize anomalies when group sizes don’t seem right.
- Route and respond to workflows based on the tag of associated entities.
- Plan activities and assess compliance of different entities (for example, ensure all of a team’s servers have upgraded to the latest Linux version)
- Report high level business and organization KPIs to know which areas of business are doing well or need improvement.
One example of a real-world observability use case using tags is a scenario where we notice that an application is suddenly throwing a high number of errors. We may already have an incident workflow setup with the right tagging schema we can know
- Which team owns this entity (reach out to them if necessary)
- Which individual(s) is responsible for the code repo (invite them to an incident war room)
- Which operational region is impacted (triage business impact, regional SLA/compliance)
- Which business unit is impacted (triage the business impact, incident cost per hour)
Approach 1: Tagging for entity organization
Tags are automatically applied to entities in some cases, from the following sources:
- Account metadata
- New Relic agent context
- OpenTelemetry agent context
- Infra agent context
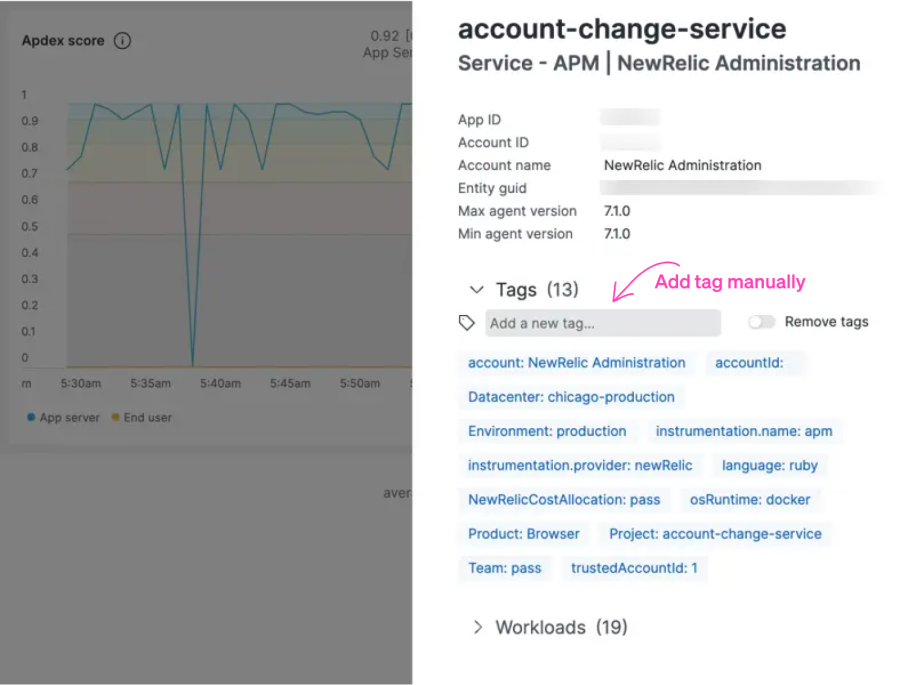
There are several ways of viewing and interacting with tags in New Relic. The simplest way is to click on the tags icon in one of our curated views such as APM. This icon also shows you the number of associated tags.

You can then view all the tags and even manually add additional ones.

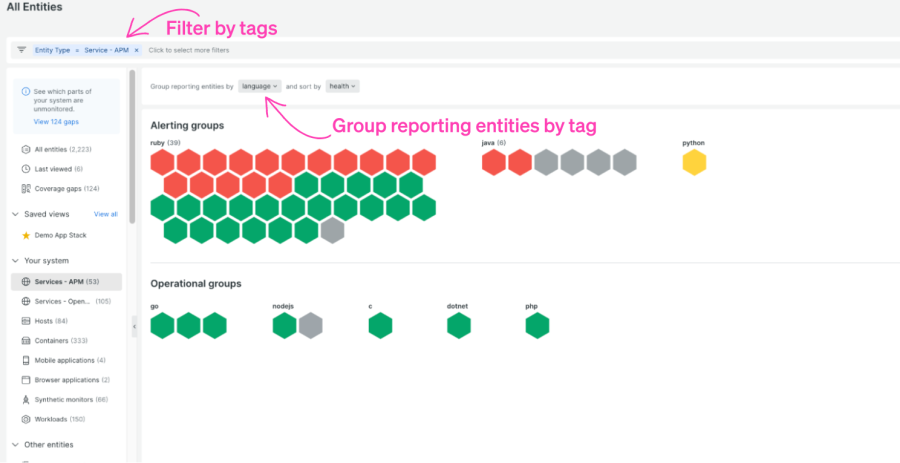
For a more holistic view you can use the entity explorer to filter and group by entities (including built in ones such as “entity type”).

For standard entity types like APM, it’s possible to incorporate tags into the New Relic Query Language (NRQL) queries. This blurs the lines between simple data organization and analytics. For example, the following query can show us the number of transaction errors associated with specific teams. Tags that are available in NRQL are prefaced with “tags”:
FROM TransactionError select count(*) facet tags.Team
The result will appear as any other attribute facet would.
Team |
Count |
|---|---|
TeamECOMMERCE |
Count6 |
It's clear that one of the most valuable uses for tags is making data more actionable. As shown above, the idea of “routing” incidents or attention can be done more effectively when we know certain things about who owns the code or how to deal with issues.
Most teams will tend to stop after tagging their team name and environment, but there’s no reason we can’t add more context such as a tag for “help-channel”.

In addition to visualizing these tags, they can be included into incident payloads as part of New Relic’s incident workflow. You can find more information on the variety of uses for tags in our docs.
Approach 2: Custom attributes for dynamic insights
There are times when the entity-centric nature of tags cannot offer the granular differentiation we need between telemetry records. When we need to be able to dynamically categorize an individual unit of telemetry we may consider custom attributes. Custom attributes are often used to capture specific characteristics of a user's experience or more generally the “state” of an application or system at a given time for a given request. Examples of dynamic state information are:
- User context
- User ID
- User location
- Other user cohort information (basic vs. pro)
- Request context
- Product or sub-product being used
- Kind of product
- Insurance policy type (car, auto, RV)
- Streaming video type (Sci-Fi, comedy, etc.)
- Detailed user device information (Android version, etc.)
While it seems like custom attributes can be an amazing solution to our metadata needs, we should be aware of a few drawbacks, including:
- Managing these is not centralized and is done at the code level.
- It’s not uncommon to accrete many obsolete attributes.
- Each attribute added incurs some additional telemetry ingest cost.
- Very high cardinality attributes can have query performance issues and impact.
- Account limits (for example, creating a unique ID for every single request made by an app isn’t sustainable).
New Relic APM, browser, and mobile agents all have built-in capabilities to inject custom attributes. More details can be found in our docs.
Approach 3: Lookup tables for ad hoc insights
It’s never going to be feasible to capture all useful meta at the time of instrumentation. A lot of metadata has an ephemeral lifecycle (project related); in some cases, we may not want the overhead of enforcing metadata standards for dozens of tags or attributes that may be used primarily for ad hoc analytics. New Relic has a solution for this. It’s possible to upload a CSV file into New Relic as a lookup table. This CSV can then be used like any other telemetry namespace (for example, Log, Transaction, SystemSample). By using NRQL’s join syntax you can relate anything in the CSV back to any existing telemetry—assuming you have a common key. This means that as long as you enforce one or two very high-level metadata elements, you can relate ad hoc lookups as needed. One real-world example is a customer who uses an organization-wide APP_ID tag. This tag is used for everything from APM, to infrastructure, to AWS streaming metrics. In this context, APP_ID is a more logical concept that refers to all related applications and infrastructure that compose a logical business service such as “Inventory Management”. This can be particularly useful for tracking projects.
Let’s assume the organization has a CSV file as “migration_status” that tracks the cloud migration status of some apps.
We can view the contents of any lookup table using the following NRQL:
FROM lookup(migration_status) SELECT *
APP_ID |
TEAM |
MIGRATED |
|---|---|---|
APP_IDAPP-1784 |
TEAMInventory Team |
MIGRATEDNo |
APP_IDAPP-1785 |
TEAMShipping Team |
MIGRATEDYes |
APP_IDAPP-1786 |
TEAMPayments Team |
MIGRATEDYes |
APP_IDAPP-1787 |
TEAMMarketing Tech |
MIGRATEDNo |
If we’ve enforced the bare minimum tag APP_ID, we can produce detailed reports of migrated hosts related to the team that owns them.
FROM SystemSample JOIN (FROM lookup(migration_status) SELECT count(*) where MIGRATED = 'Yes' FACET APP_ID, TEAM limit max) ON APP_ID SELECT uniqueCount(hostname) as 'Hosts Migrated By Team' where APP_ID is NOT NULL facet TEAM since 1 week ago
TEAM |
HOSTS MIGRATED BY TEAM |
|---|---|
TEAM Inventory Team |
HOSTS MIGRATED BY TEAM5 |
TEAM Shipping Team |
HOSTS MIGRATED BY TEAM7 |
A simple example metadata standard
This simple five-part tagging “standard” is a distillation of a variety of approaches used for observability at a number of organizations. An organization may modify this and extend it greatly, but this represents a fairly lightweight set of tags that can be used to start demonstrating the value of metadata in your organization.
|
Name |
Example Values |
Description |
Major Value |
|---|---|---|---|
|
Environment |
“dev”, “prod”, “staging” |
The environment in which the entity is deployed. |
Triaging incidents, developing observability standards, setting SLAs. |
|
Region |
“emea”, "americas", “apac”, “us east”, “us west”, “us central” |
The region in which an entity is deployed or the region in which it is served (abbreviations differ by company). |
Assessing impact, incident responsibility, compliance analytics. |
|
Team |
“marketing eng”, “db eng”, “mobile eng”, “sre”, “cloud infra” |
The team responsible for this entity. These are unique to each organization. |
Incident triage, incident responsibility, incident routing. |
|
Code Owner |
“jsmith”, “akim", "gjones”, “kim h” |
One or more individuals technically responsible for code reviews and repository management for a given entity (where relevant). |
Postmortem and deep dive analysis, “war room” organization, routing system updates, and standards compliance. |
|
Line of Business / Business Unit |
“Small Business Loans”, “Commercial Banking”, “Loans”, “Auto Insurance”, “Market Research”, “Asset Management”, “Sports”, “New”, “Entertainment” |
Many companies break their business into different dimensions into which they track ownership of assets and overall KPIs. These are highly variable across businesses but are usually well understood within an organization. This is useful for strategizing and doing quality assessments. |
Business impact of outages, executive alignment of systems, strategic planning, alignment to business priorities. For example, a bank may have different lines of business such as retail banking, commercial banking, wealth management, and investment banking. |
Teams vs. Code Owners
Teams are groups of individuals who collaborate and work together on various aspects of the application development and maintenance. A team can consist of developers, designers, testers, project managers, and other stakeholders involved in the software development lifecycle.
Code ownership helps establish accountability and ensures that someone is responsible for maintaining and reviewing code changes in specific parts of the application.
Las opiniones expresadas en este blog son las del autor y no reflejan necesariamente las opiniones de New Relic. Todas las soluciones ofrecidas por el autor son específicas del entorno y no forman parte de las soluciones comerciales o el soporte ofrecido por New Relic. Únase a nosotros exclusivamente en Explorers Hub ( discus.newrelic.com ) para preguntas y asistencia relacionada con esta publicación de blog. Este blog puede contener enlaces a contenido de sitios de terceros. Al proporcionar dichos enlaces, New Relic no adopta, garantiza, aprueba ni respalda la información, las vistas o los productos disponibles en dichos sitios.


