Why DevOps Teams Lack Visibility in Distributed Environments
Modern infrastructures need modern monitoring.
Today’s software and infrastructure environments are constantly changing, whether you're modernizing applications or adopting microservices.
As infrastructure grows more distributed to deliver speed and scale, monitoring tools often multiply and data becomes fragmented. Lowering MTTR and maintaining uptime requires a new approach to infrastructure monitoring—one that fights tool sprawl and delivers context into complexity.
Download our eBook Why DevOps Teams Lack Visibility in Distributed Environments to find out:
-
How tool sprawl is costing you and your team
-
Why context and end-to-end visibility is mission-critical for your business
-
Three examples of customized insights that context can deliver
In a Changing Environment, Context Is Mission-Critical
The way teams deliver and operate software has evolved rapidly over the past decade. As a result, the surface area that IT operators have to manage is expanding just as quickly—in size and complexity.
While change was once considered a liability in the world of infrastructure, it’s now become the basis of competitive advantage.
You’re adopting DevOps practices to ship infrastructure and applications faster and more frequently. You’re modernizing your applications to achieve better velocity, scalability, and performance. You’re moving to the cloud. You’re adopting microservices. You’re running container orchestration systems like Kubernetes.
Rapid, relentless change is now baked into the very fabric of infrastructure management.
More changes to software, more configurations, more alerts, more everything. And at the same time there’s more pressure to detect and resolve problems faster, as well as to ensure the stability and reliability of production systems.
The complexity that we’ve created in the name of speed and scale has resulted in the need to shift left in monitoring strategies. The fact is that in many cases you won’t know how your system is going to behave until it’s in production, and that requires a system that’s observable in production.
This change in approach helps teams to stay on top of their dynamic systems.
The problem is, different teams frequently use different tools to monitor their parts of the stack. One tool for developers, one for IT operators, one for business managers; one tool for logs, one for metrics, one for traces, one for on-prem, one for cloud.
In each case, the tool adopted is no doubt the right one for the team.
But in practice, it also means every team is now dealing with more alerts, more telemetry, and more critical—but fragmented—operational data.
That’s the problem with tool sprawl: fragmented observability is not observability at all.
Each tool only shows you part of the picture, but in reality, the full picture is dynamic. Lines blur between parts of the stack. An application crashes and you need to find out what happened in the code or infrastructure before the damage spreads, but suddenly using disparate point solutions for each system component is costing you time and money.
Your data ends up trapped in silos; every tool has a different vocabulary and so teams are at cross-purposes; and crucially, it hurts your MTTD and MTTR.
The thing is, the costs aren’t just financial. They have a waterfall effect across the business. IT and ops teams spend too much time troubleshooting and not enough innovating. Alignment and collaboration between teams suffers. Employee morale suffers.
The business suffers.
In this guide, we’ll look at all the ways in which tool sprawl can hurt your business. But we’ll also look at the world of possibilities that opens up for your teams when you overcome it.
How Bad Is the Problem of Tool Sprawl?
Numbers alone don’t tell the story—but according to a 451 Research survey, 39% of respondents were juggling 11 to 30 monitoring tools in an effort to keep an eye on their application, infrastructure, and cloud environments—with 8% using between 21 and 30 tools.
Now, many of those are likely to be open source (and therefore “free”), but the associated costs—before we even get to downtime—have a way of adding up quickly.
It slows your people down
The first problem with tool sprawl is the sheer amount of time people lose when they’re switching context from one tool to another. What may appear to be a matter of seconds or minutes in a specific situation adds up to a much larger problem when it’s scattered across the organization.
It lowers data resolution
If you’re using different tools to monitor different parts of your IT stack, you’re bound to lack good visibility into your environment because you won’t be able to correlate system health with application performance across all your components.
It adds to your admin
Though certain tools themselves may have no upfront cost, you still have to set up, maintain, and manage them—dealing with software licenses, internal resourcing, add-on modules, storage, hardware, API access, and management. Even within one team, that’s a lot to deal with.
Scale these problems across a distributed environment and all of a sudden the inefficiency becomes glaringly obvious.
The result of all this is that incidents take longer to resolve. For some issues, the root cause can’t be identified because the data is so scattered, so you start getting issues that can easily have a negative impact on the end-user experience. Especially when your users are the ones reporting those issues in the first place.
There’s a direct link between downtime and cost to the business, and that cost can be extreme.
According to Gartner, the average cost of one hour of downtime is $300K, with 33% of enterprises reporting that one hour of downtime actually costs their firms $1-5 million.
But the bigger picture here is that you need a clear view of what’s going wrong to be able to prevent problems.
And the even bigger picture is what becomes possible when you do have context.

What Happens When You Have Complete Context
Observability and monitoring don’t exist for their own sake.
There are three primary goals to a successful monitoring and observability practice:
- Increase revenue
- Improve customer engagement
- Create operating efficiencies
All of these are about the business.
Achieving these goals isn’t simply about collecting as much data as possible. Rather, it’s about being able to intuitively connect the dots between your data and, crucially, gaining the ability to ask critical questions of your system.
But even if more data means more potential insight, the more tools you use, the more difficult this becomes.
So more tools ≠ more insight.
If monitoring is a means to an end, the only factors that truly matter are:
- How much business value does your monitoring solution deliver?
- How effective and useful is it for troubleshooting?
- How well can the data be exploited to identify and resolve critical issues?
The time lost from switching between tools and taking extra time to diagnose and resolve problems can be crucial.
Because if monitoring lets you gather metrics across your entire stack, but cannot help you solve for business-critical issues, then it is a waste of resources.
That’s where context is essential. And why having a single observability platform changes everything.
The power of context
Observability with context is what you get with a single platform to observe your entire stack.
It’s end-to-end: spanning your infrastructure, applications, and end-user experience across your web and mobile applications, as well as incorporating all types of telemetry (metrics, events, logs, traces) in one place.
It makes sense of your data by surfacing the meaningful connections within it, thereby helping teams find and troubleshoot issues faster.
And it can give you the agility to configure your data to build useful applications for your teams, that connect infrastructure health and performance to business outcomes and customer experience.
The ability to build your own custom, interactive visualizations lets your different teams see their data configured exactly how they want and however it’s most relevant to them.
The ability to combine everything you know about your business with powerful application-building capabilities; that’s not just context—it’s context specific to your exact needs. So you can get past firefighting and on to fireproofing.
Here are some examples of what that might look like. Take a look—and while you’re at it, it’s also worth thinking about what you might program to help solve your business’ critical issues.
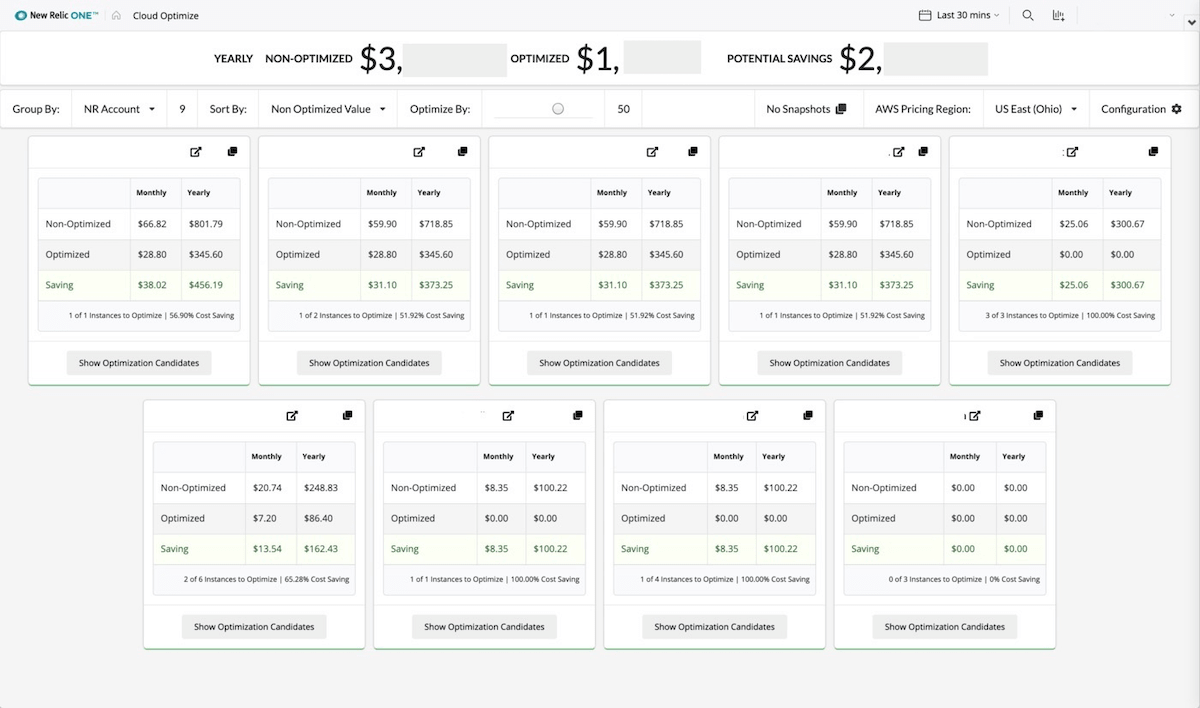
Stay on top of your cloud spend
Compare the size of your cloud instances to their utilization so teams can quickly identify resources that are potentially overprovisioned. Get even more granular and select hosts, regions, and other configurations to specify your own unique business use cases.

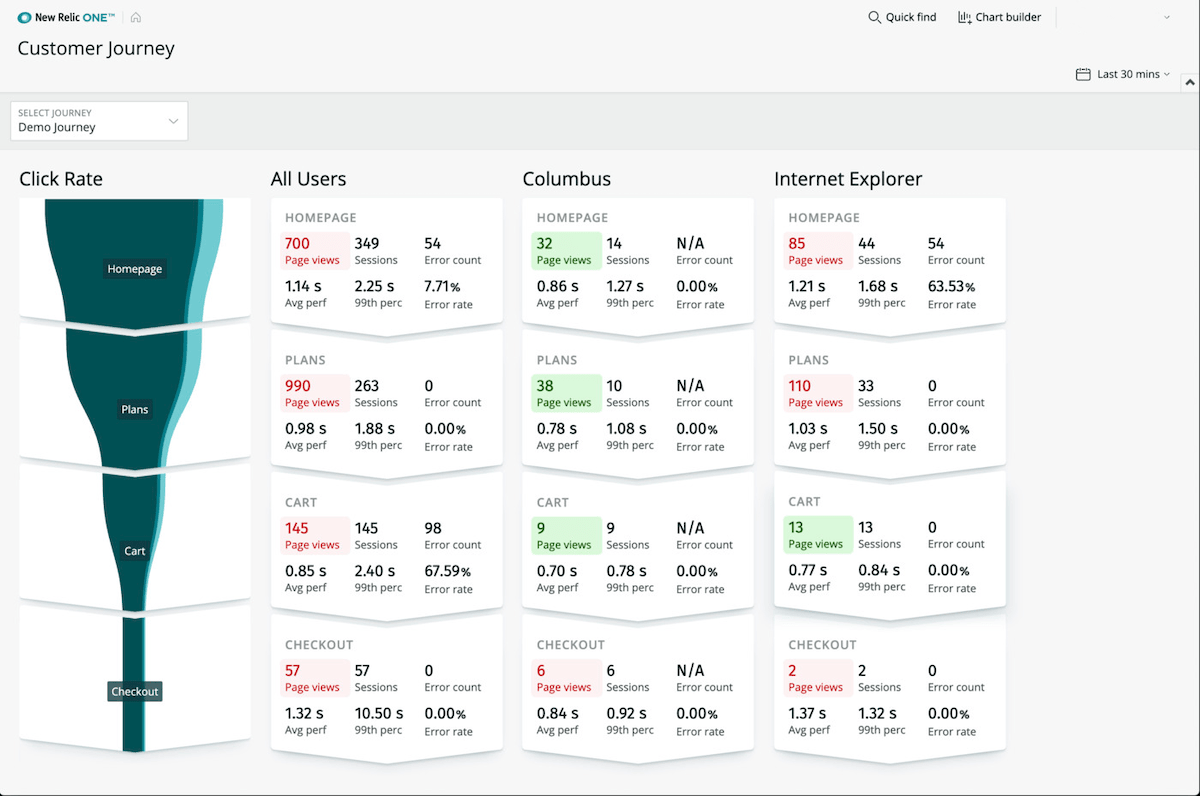
Understand customer conversion
Analyze and customize the steps of your buyer journey in an interactive interface. View standard data for each step, such as page views, error rate, and error count. Dig deeper into metrics for each step in the funnel.

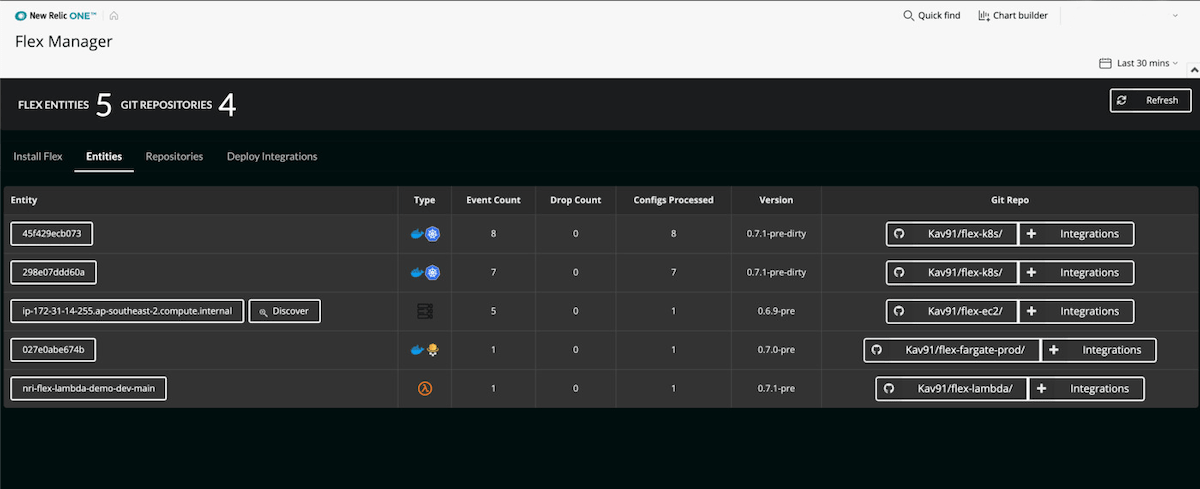
Build new infrastructure integrations seamlessly
The endpoints that ops teams are using are growing exponentially. Leverage the power of an agnostic, all-in-one integration that makes aggregating data from third-party sources easier than ever, so teams have the context they need to troubleshoot their specific infrastructure environment.

Infrastructure Needs Context
Just like observability, infrastructure doesn’t exist for its own sake either. It exists in the context of a wider stack. A stack that exists in the wider context of a customer experience that is critical for your business to get right.
So even though the constant change that has come to define modern infrastructure management makes it harder to detect and solve application issues quickly, it’s never been more important to get it right.
That’s why point solutions—those that rely on siloed data to monitor only one part of your stack, such as logging, or Linux infrastructure—create such a paradox. They serve a need for the individual team using them, but they wreak havoc as soon as you go beyond the confines of that specific set of components.
In the rush to improve MTTR, reduce downtime, and prevent interruptions to the end-user experience, when something crashes you want to be able to immediately address two questions: what’s broken, and why?
Only with the full context an observability platform provides can you get past the “what” and swiftly into the “why,” empowering teams to answer these questions quickly and minimize the likelihood of downtime or a bad end-user experience.
By correlating disparate data from infrastructure, logs, configuration changes, applications, and frontend services in one place, a modern infrastructure and observability platform surfaces data in the right context.
That means ops teams understand precisely how their infrastructure is impacting their applications—and vice versa.
If you think you can get more meaningful insights from your data, we should talk
New Relic One lets development and operations teams all get access to the same data in a single platform with the quickest and most precise application and infrastructure correlation capabilities to identify and solve problems faster.
So whatever happens in your software, you can find and fix the problem before it affects the end-user experience.


