Quickstart
Why port monitoring?
A port is a point where network connections start and end. It is a logical construct that identifies a specific process or service. The New Relic port monitoring quickstart empowers you to monitor the status of networking ports such as Transmission Control Protocol (TCP) and User Datagram Protocol (UDP).
Port quickstart highlights
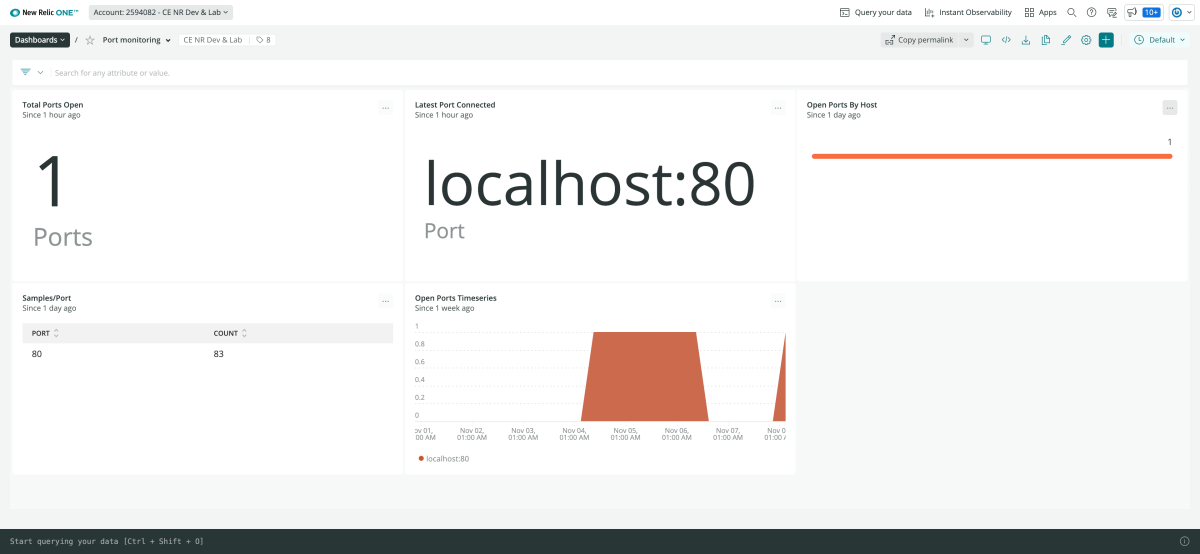
The New Relic port monitoring quickstart has the following features: Dashboards: Our dashboards effectively track metrics like total ports open, latest port connected, samples/port, open ports’ timeseries, and open ports by host. Detailed installation, configuration, and changelog details in GitHub.
New Relic + port = Optimum performance monitoring
New Relic on-host integration for port monitoring tracks the up and down status of a network port like TCP, UDP, etc. It then reports the data for you to identify issues and solve them quickly. The dashboards provide interactive visualizations to explore your data and understand context. In particular, the dashboard offers you the ability to drill down into performance details like the total number of open ports or identify the latest port connected. The port instant observability quickstart provides the necessary insights to make your port troubleshooting easier and more efficient. To use our port monitoring integration, you need to install the New Relic infrastructure agent. You’ll also need to configure the port-monitor-config.yml.sample file. Download the New Relic port quickstart today to monitor your port’s key performance indicators and address issues efficiently. It’s the fastest path to a seamless network port or switch port monitoring.
Need help? Visit our Support Center or check out our community forum, the Explorers Hub.

