Quickstart
Why should you monitor your usage of MosaicML?
Monitor your application powered by MosaicML language models to ensure, get visibility to what you send to MosaicML, responses received from MosaicML, latency, usage and errors. By monitoring the usage, you can infer the cost.
Track the LLM's performance:
Monitor the input & output, latency and errors of your LLM provider. Track performance changes with the providers and versions of your LLM. Monitor usage to understand the cost, rate limits, and general performance.
Track your app:
By tracking key metrics like latency, throughput, error rates, and input & output, you can gain insights into your MosaicML app's performance and identify areas of improvement.
Early issue detection:
Detect and address issues early to prevent them from affecting model performance.
Comprehensive MosaicML monitoring quickstart
Our MosaicML quickstart provides metrics including error rate, input & output, latency, queries, and lets you integrate with different language models.
What’s included in the MosaicML quickstart?
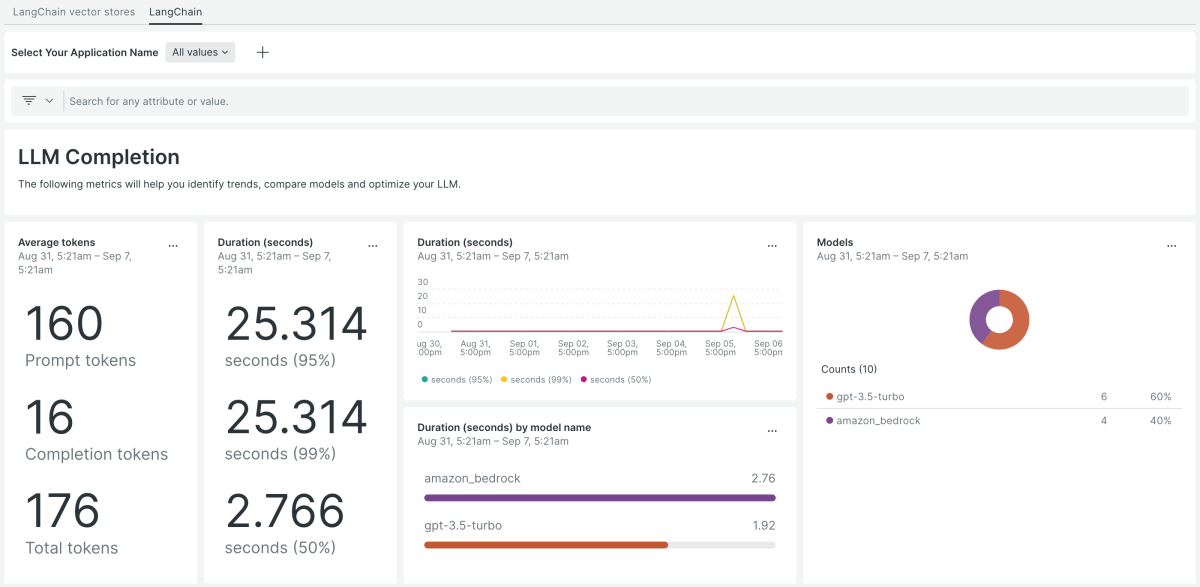
New Relic MosaicML monitoring quickstart provides a variety of pre-built dashboards, which will help you gain insights into the health and performance of your MosaicML usage. These reports include:
- Dashboards (average tokens, LLM completion’s details, chain’s details, tool details, top tool names and many more)
- Alerts (errors, request per model and response time)
Need help? Visit our Support Center or check out our community forum, the Explorers Hub.

