No momento, esta página está disponível apenas em inglês.
 / 
Apache Hadoop

Apache Hadoop

Optimize your Apache Hadoop performance using New Relic Apache Hadoop monitoring.

What's included?

dashboards
1
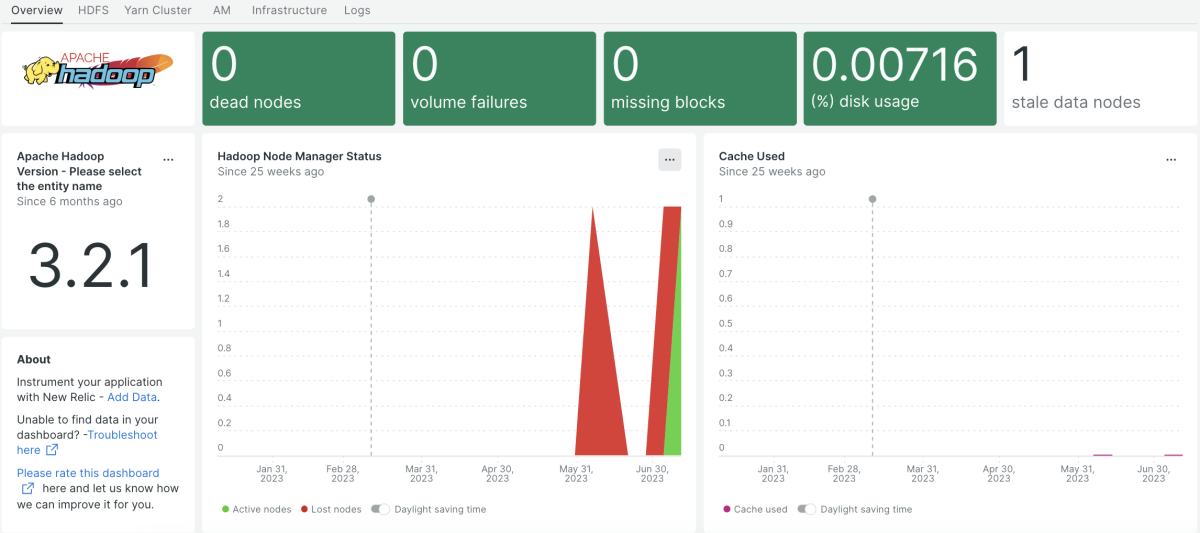
Apache Hadoop quickstart contains 1 dashboard. These interactive visualizations let you easily explore your data, understand context, and resolve problems faster.
alerts
4
Apache Hadoop observability quickstart contains 4 alerts. These alerts detect changes in key performance metrics. Integrate these alerts with your favorite tools (like Slack, PagerDuty, etc.) and New Relic will let you know when something needs your attention.
Used Disk Percent
This alert is triggered when disk usage exceeds 90% for at least 5 minutes.
NameNode Volume Failures
This alert is triggered if the volume failures exceeds 2 for 5 minutes.
Missing Blocks in HDFS
This alert is triggered if the missing blocks exceeds 3 for 5 minutes.
Dead DataNodes
This alert is triggered if the dead DataNodes exceeds 1 for 5 minutes.
documentation
1
Apache Hadoop observability quickstart contains 1 documentation reference. This is how you'll get your data into New Relic.

Comprehensive monitoring quickstart for Apache Hadoop

Apache Hadoop metrics are statistical data that Hadoop daemons offer and are used for performance adjustment, debugging, and monitoring. By integrating Apache Hadoop with New Relic, you can get comprehensive information about the workflow by visualizing and gathering metrics and logs.

Why monitor Apache Hadoop?

Apache Hadoop is an open-source software package which enables distributed storage and processing of massive data by leveraging a network of computers. It utilizes the MapReduce programming model-based distributed storage and processing of massive data.

By leveraging New Relic, you can gain a more in-depth understanding of Apache Hadoop performance and health. Monitoring Apache Hadoop with New Relic will help you better understand the HDFS (Hadoop Distributed File System), blocks, system load, data nodes, NodeManager, and jobs.

What’s included in this quickstart?

New Relic Apache Hadoop monitoring quickstart provides quality out-of-the-box reporting:

  • JVM metrics
  • NameNode metrics
  • DataNode metrics
  • Cluster metrics
  • Queue metrics
  • Node manager metrics
  • Infrastructure metrics

How to use this quickstart

  • Sign Up for a free New Relic account or Log In to your existing account.
  • Click the install button.
  • Install the quickstart to get started or improve how you monitor your environment. They're filled with pre-built resources like dashboards, instrumentation, and alerts.
Authors
New Relic
Support
BUILT BY NEW RELIC
Need help? Visit our Support Center or check out our community forum, the Explorers Hub.