Quickstart
Why should you monitor your usage of Supabase?
Monitor your vector searches on Supabase to get visibility on what you send to Supabase, responses retrieved from Supabase, latency, usage and errors.
Track the query performance of your Vector DB
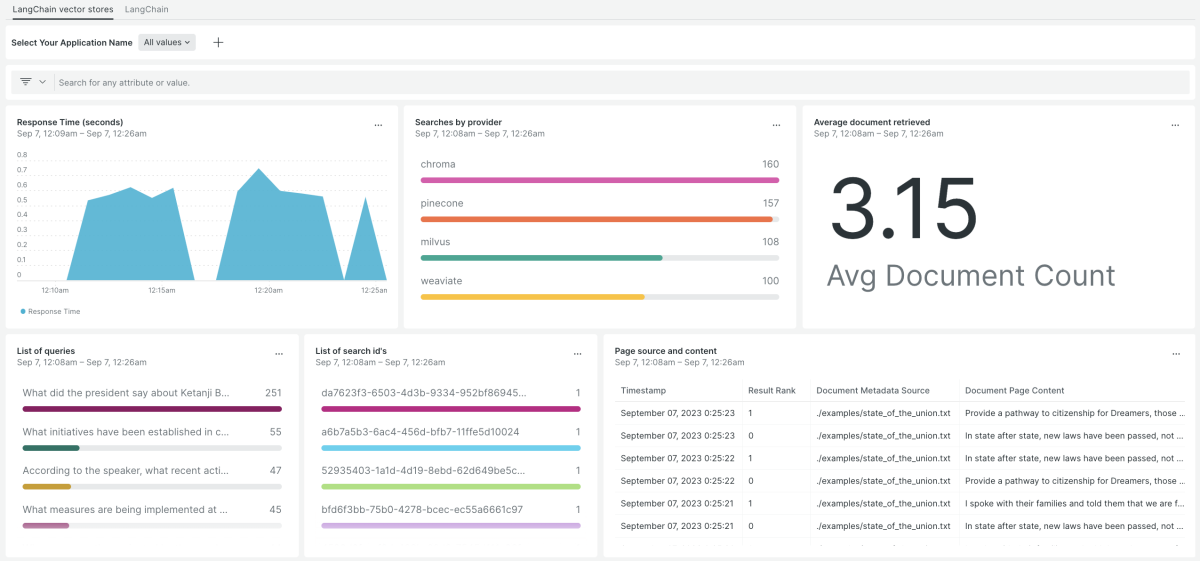
Track the behavior of your vector stores. Monitor the latency, queries, the number of documents retrieved, and the content of the documents so that you can evaluate their relevance.
Track your app:
By tracking key metrics like latency, throughput, error rates, and input & output, you can gain insights into your app's performance and identify areas of improvement.
Comprehensive monitoring quickstart for your Supabase app
Our Supabase quickstart provides metrics including Identify popular queries, sources, and content.
What’s included in this quickstart?
New Relic Supabase monitoring quickstart provides a variety of pre-built dashboards, which will help you gain insights into the health and performance of your Supabase app. These reports include:
- Vector searches
- Alerts for errors, search per vector store, and response time
- Identify popular queries, sources, and content
Need help? Visit our Support Center or check out our community forum, the Explorers Hub.


