Quickstart
Integration Features
Dashboards
Alerts
Documentation
dashboards
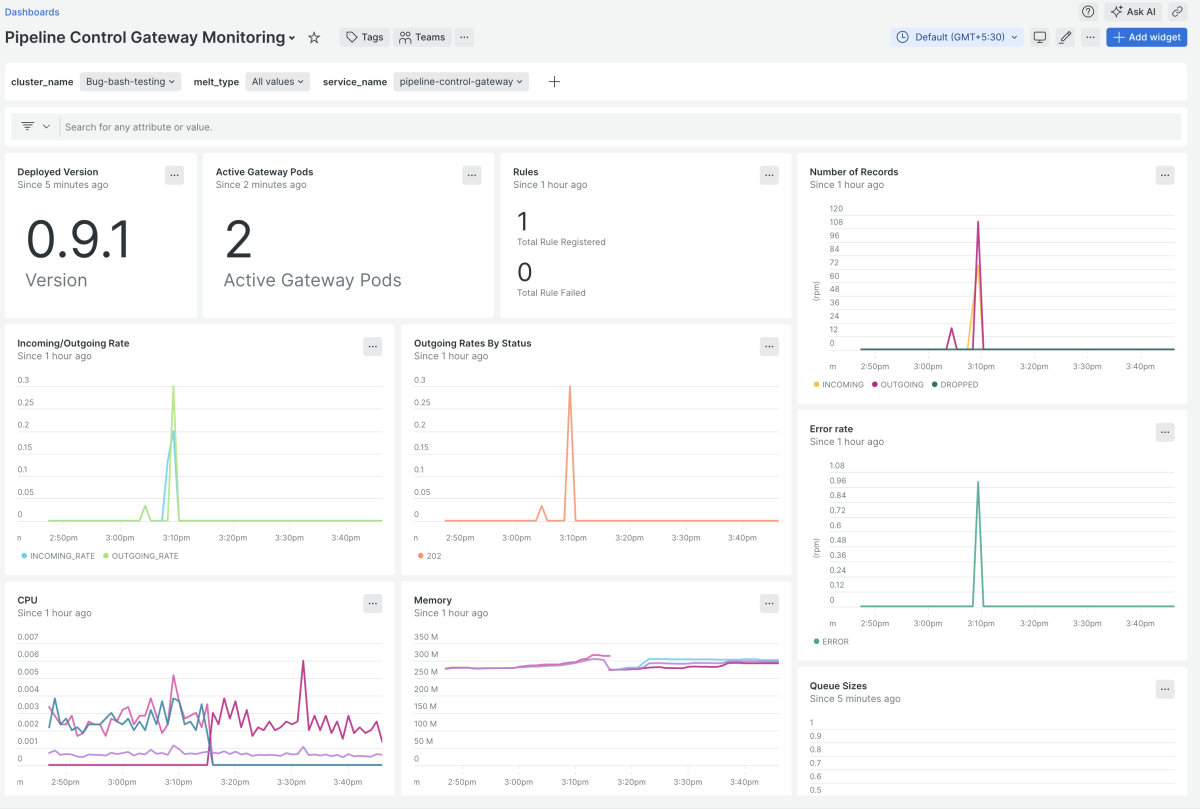
Pipeline Control gateway quickstart contains 1 dashboard. These interactive visualizations let you easily explore your data, understand context, and resolve problems faster.
Show MoreShow Less
Pipeline Control Gateway Monitoring
See all
alerts
Pipeline Control gateway observability quickstart contains 7 alerts. These alerts detect changes in key performance metrics. Integrate these alerts with your favorite tools (like Slack, PagerDuty, etc.) and New Relic will let you know when something needs your attention.
Show MoreShow Less
1. Deployment Unhealthy
Gateway deployment has been unhealthy for over 5 minutes.
2. CPU Usage Critical
Gateway CPU usage has exceeded 60% for over 5 minutes.
3. Slow Request Response
Over 99% of gateway requests have exceeded 5 seconds latency for the past 5 minutes.
4. Memory Usage Critical
Gateway memory usage has exceeded 60% for over 5 minutes
5. High Error Rate
Gateway has experienced over 20 errors in the last 5 minutes
6. High error rate
Alert triggered when the error rate(4xx/5xx errors) exceeds 5% during 5 minutes
7. Service Unavailability
The service health status metric has not been reported in the last 5 minutes, indicating potential unavailability.
documentation
Pipeline Control gateway observability quickstart contains 1 documentation reference. This is how you'll get your data into New Relic.
Show MoreShow Less

