What's included?
dashboards
1
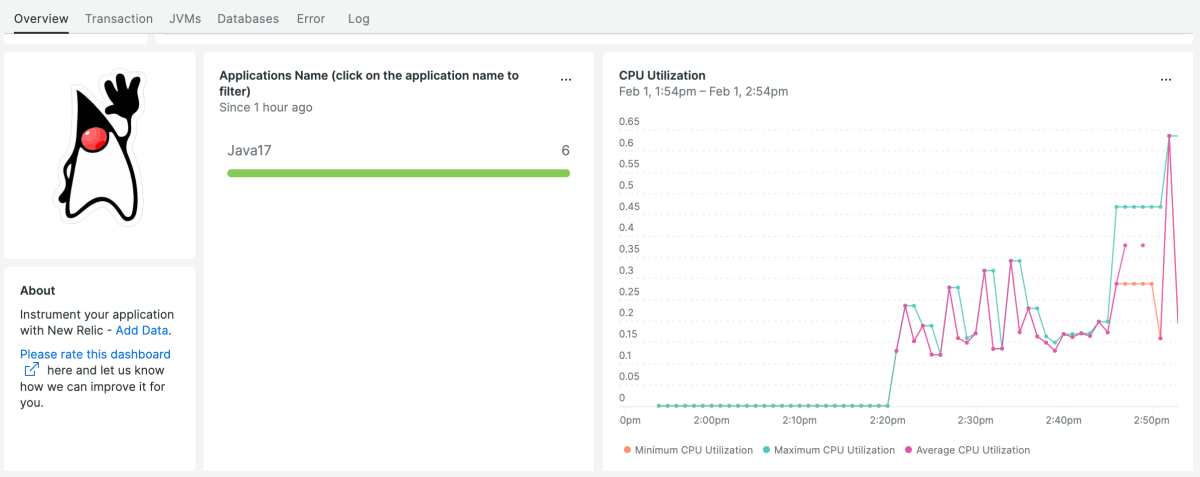
JDBC-ExecuteBatch Java Agent Extension quickstart contains 1 dashboard. These interactive visualizations let you easily explore your data, understand context, and resolve problems faster.
Java
alerts
2
JDBC-ExecuteBatch Java Agent Extension observability quickstart contains 2 alerts. These alerts detect changes in key performance metrics. Integrate these alerts with your favorite tools (like Slack, PagerDuty, etc.) and New Relic will let you know when something needs your attention.
Transaction Errors
This alert is triggered when the the transactions fail more than 10% of the time in 5 minutes.
High CPU Utilization
This alert is triggered when the CPU Utilization is above 90%.
documentation
1
JDBC-ExecuteBatch Java Agent Extension observability quickstart contains 1 documentation reference. This is how you'll get your data into New Relic.
What is executeBatch call?
ExecuteBatch method in jdbc submits a batch of commands to the database for execution. You If all commands execute successfully, the call returns an array of update counts.
Once the instrumentation is deployed it will start to track the call to the executeBatch method as a database call in distributed traces.
The Performance tab for the call will show the query as "Batch Execute n Queries" where n is the number of queries executed as part of the batch.
- For calls to addBatch(String sql), it will represent the number of calls to this method before the executeBatch method is executed.
- For PreparedStatment and CallableStatment it will represent the number of times that addBatch() is called.