Quickstart
HTTPRouter and Golang| complete monitoring quickstart
HTTPRouter Golang monitoring provides a new level of application visibility. The Golong-based HTTPRouter also focuses on performance and light resource usage.
Monitoring HTTPRouter
New Relic’s HTTPRouter Golang monitoring quickstart helps development teams set up monitoring tools and dashboards to quickly identify and fix errors in their Golang applications. As a Golang developer, you can create custom queries, leverage user-related data to optimize processes, and share highly visual interactive displays of data.
New Relic and HTTPRouter features
Track Golang language apps and microservices with New Relic’s HTTPRouter and Golang monitoring quickstart, including throughput, transaction errors, and response times.
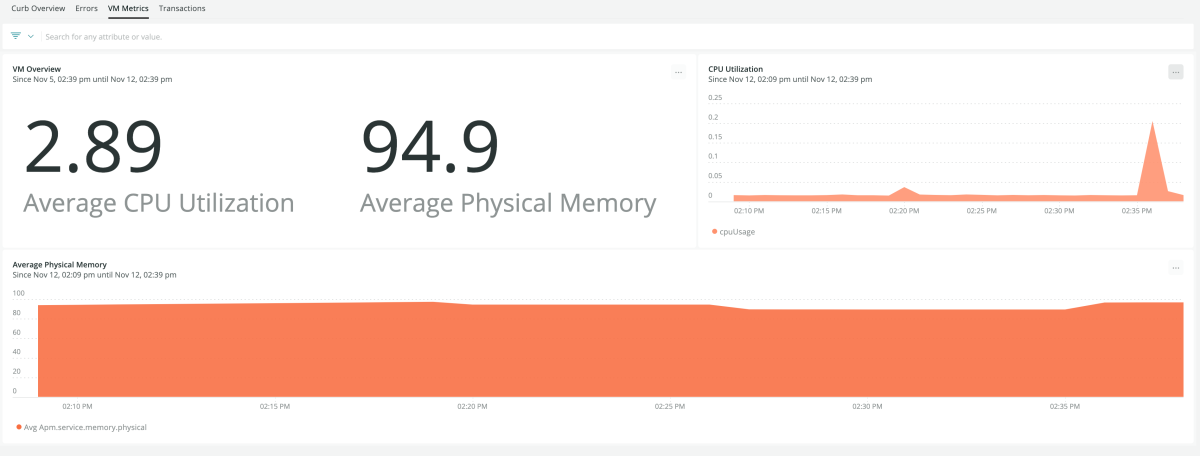
With a clear view into garbage collection behavior, memory usage, and CPU usage over time, your Golang development team can better understand your application’s runtime health. HTTPRouter infrastructure monitoring also provides a comprehensive view of host and server data.
Key features include:
- Browser monitoring to track browser performance and usage
- Cross-application tracing to monitor transactions between APM-monitored apps
- Deployment markers for tracking code changes and overall impact on application health and performance
- Distributed tracing to better understand how your services and microservices interact
- Monitoring Goroutine counts for possible Goroutine leaks
- Providing real-time alerting notifications for errors or problems before they impact users
- Tracing asynchronous applications and creating segments in multiple Goroutines
- Synthetic transaction tracing to connect requests from synthetic monitors to underlying APM transactions
- Tracking important metrics by building custom dashboards
New Relic's complete monitoring quickstart helps Golang development teams set up monitoring tools and dashboards to minimize complexity and improve efficiency, and ensure uptime.
Need help? Visit our Support Center or check out our community forum, the Explorers Hub.

