New Relic Now Start training on Intelligent Observability February 25th.
Save your seat.
현재 이 페이지는 영어로만 제공됩니다.
 / 
Azure Time Series Insights

Azure Time Series Insights

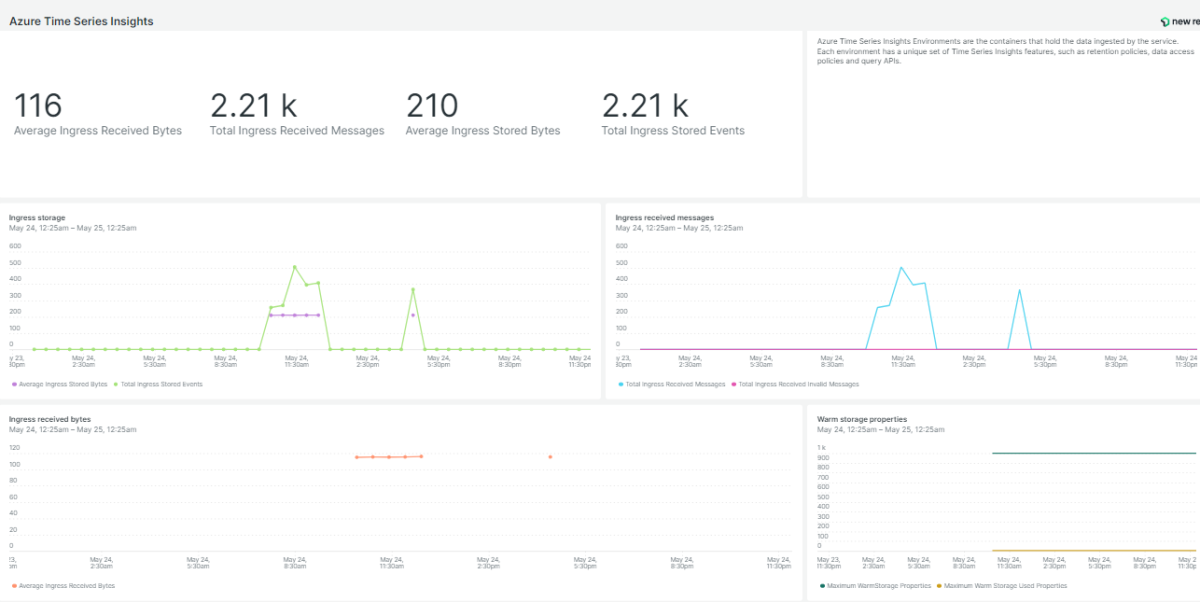
Monitoring Azure Time Series Insights Cloud is a fully visualization service that makes it easy to explore and analyze via key metrics. Install the New Relic Azure Time Series Insight monitoring quickstart to get a pre-built dashboard tailored to monitor your Azure Time Series Insights service.

What's included?

dashboards
1
Azure Time Series Insights quickstart contains 1 dashboard. These interactive visualizations let you easily explore your data, understand context, and resolve problems faster.
documentation
1
Azure Time Series Insights observability quickstart contains 1 documentation reference. This is how you'll get your data into New Relic.
alerts
0
This quickstart doesn't include any alerts. Do you think it should?
You can edit this quickstart to add helpful components. View the repository and open a pull request.
View repo View repo

What is Azure Time Series Insights?

Azure Time Series Insights are the containers that hold the data ingested by the service. Each environment has a unique set of Time Series Insight features, such as retention policies, data access policies and query APIs.

New Relic Azure Time Series Insights quickstart features

A standard dashboard that tracks key indicators like ingress storage, ingress received bytes, ingress received messages and warm storage used properties. It runs custom queries and visualizes the data immediately.

Why monitor Time Series Insights with New Relic?

New Relic Azure Time Series Insights monitoring quickstart empowers you to track the performance of Azure Time Series Insights via different metrics including ingress storage, ingress received bytes, ingress received messages and warm storage used properties.

Our integration features a standard dashboard that provides interactive visualizations to explore your data, understand context and get valuable insight.

Start ingesting your Azure data today and get immediate access to our visualization dashboards so you can optimize your Azure service.

How to use this quickstart

  • Sign Up for a free New Relic account or Log In to your existing account.
  • Click the install button.
  • Install the quickstart to get started or improve how you monitor your environment. They're filled with pre-built resources like dashboards, instrumentation, and alerts.