Quickstart
What is Azure Storage?
Azure Storage is Microsoft’s cloud storage solution that offers highly available, scalable, secure, and durable storage for different data objects in the cloud.
New Relic Azure storage quickstart features
The New Relic Azure Storage monitoring integration has the following features:
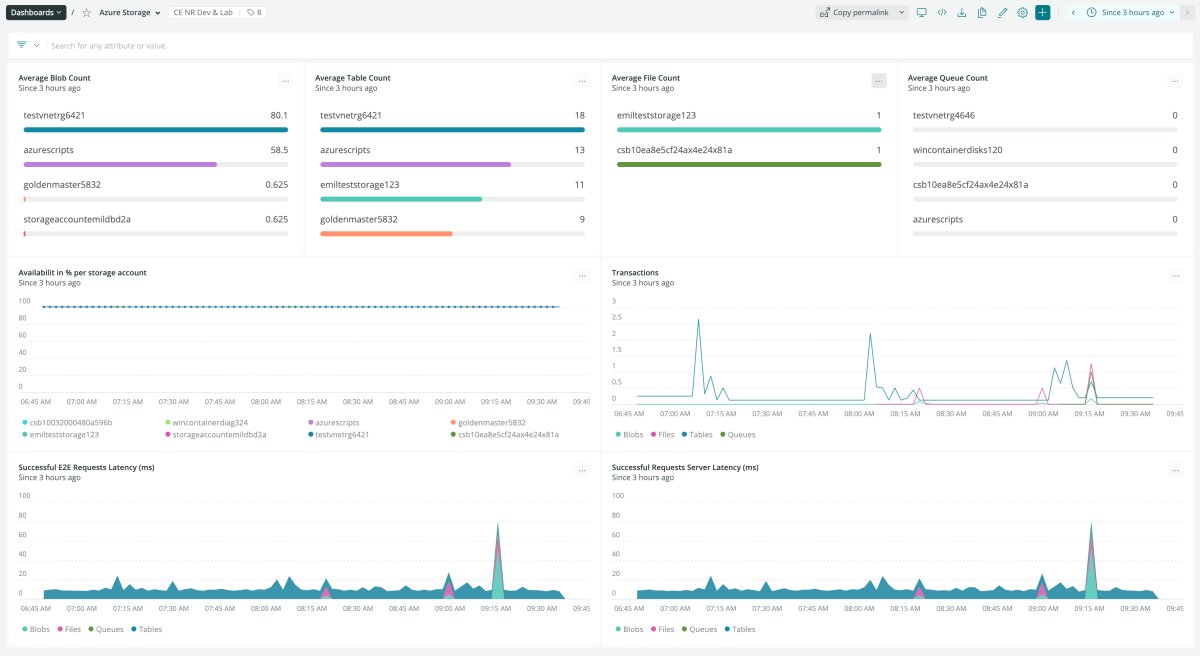
- A standard dashboard that tracks key indicators like average blob count, average table count, average file count, and average queue count
- Additional dashboards that track transactions, availability in % per storage account, successful requests’ server latency (ms), and more
- Run custom queries and visualize the data immediately
Why monitor Azure Storage with New Relic?
New Relic Azure Storage monitoring quickstart empowers you to track the performance of Azure Storage via different metrics including account used capacity, the amount of ingress and egress data, and latency.
Our integration features a standard dashboard that provides interactive visualizations to explore your data, understand context, and get valuable insights. We’ve also made it easy for you to view your data in pre-built dashboards, create specialized alerts, and run custom queries with immediate data visualization.
Start ingesting your Azure data today and get immediate access to our visualization dashboards so you can optimize your Azure service.
Need help? Visit our Support Center or check out our community forum, the Explorers Hub.

