With the breakneck pace of modern digital business, you need observability at all times, not just when you’re sitting at your desk or looking at a dashboard on a wall-mounted screen. That’s why we enable you to monitor your app’s performance anytime, anywhere with New Relic’s free mobile apps (not to be confused with New Relic Mobile, which monitors your mobile apps and backend systems). The New Relic mobile app and New Relic Insights mobile app are both available for iOS and Android.
New Relic mobile app: iOS Android
New Relic Insights mobile app: iOS Android
In the New Relic mobile app, you can track real-time and historical app performance to view key transaction data and app errors, and stay on top of any incoming issues with push notifications. And with the Insights mobile app, you can access all of your custom instrumented dashboards.
But now, with recent updates including new language agents and sharing features, our mobile apps are even more powerful.
New Relic app and Insights app users can now monitor their Ruby VM, JVM, Elixir, Node.js, and Go applications, and view and share Insights dashboards with history and favorites functionality—right on their mobile devices. These exciting new features let users investigate, understand, and share critical information with their teams without having to sit at a computer.
New agent monitoring with Ruby VM, JVM, Elixir, Node.js, and Go APM
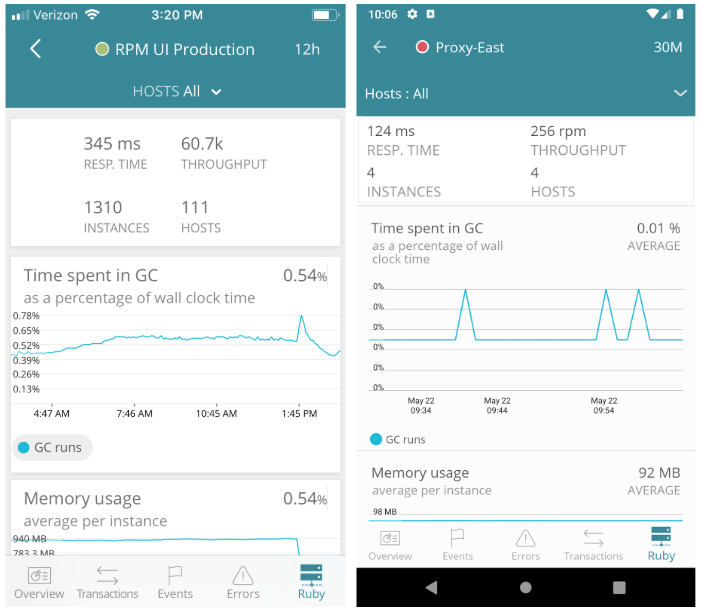
New Relic mobile app users can now monitor their Ruby VM, JVM, Elixir, Node.js, and Go APM applications directly from their phones with just a few clicks. Simply open up an application with one of these agents, and find the agent icon automatically available through the bottom navigation. Once you click into the applicable agent, you can see the VM or runtime charts for the agent, just as you would using New Relic on your computer.

Share dashboards with the New Relic Insights app history and favorites features
Ever step away from your laptop, only to receive a New Relic Insights request from a teammate? No problem: Now you can share dashboards right from your phone, without ever having to open your laptop.
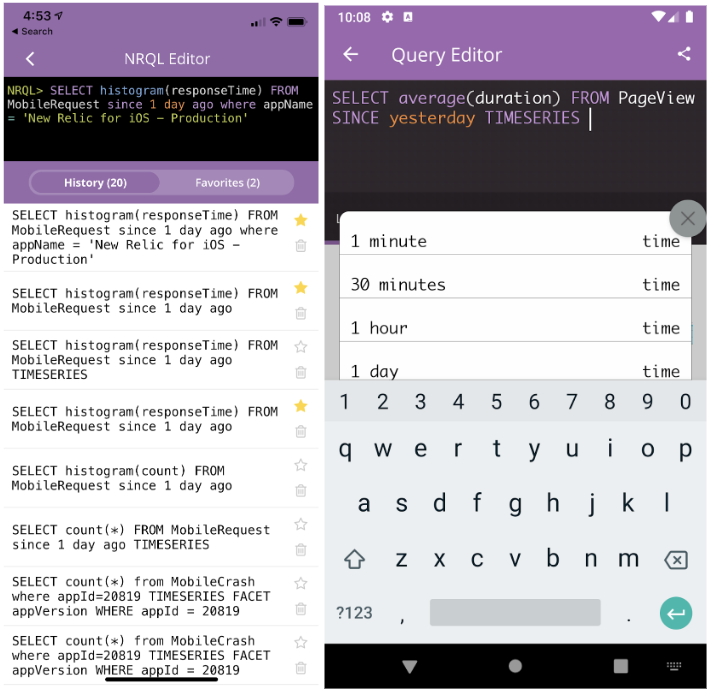
Simply open New Relic Insights in the Insights mobile app; use the new history and favorites features to tweak specific queries and generate the appropriate histogram; and communicate the results to your team using the share feature. Now, you can do all of this, right from the New Relic Insights mobile app, in less than a minute.

These key new features provide easy access to the information you need to track down performance issues quickly, diagnose their causes, and share the results with your team, all from your mobile device. You can follow your team’s progress in resolving unexpected issues, share important queries, or simply check on the health of your system—anywhere, at any time.
Take your data to go by downloading the New Relic app and New Relic Insights app today.
New Relic mobile app
New Relic Insights mobile app
이 블로그에 표현된 견해는 저자의 견해이며 반드시 New Relic의 견해를 반영하는 것은 아닙니다. 저자가 제공하는 모든 솔루션은 환경에 따라 다르며 New Relic에서 제공하는 상용 솔루션이나 지원의 일부가 아닙니다. 이 블로그 게시물과 관련된 질문 및 지원이 필요한 경우 Explorers Hub(discuss.newrelic.com)에서만 참여하십시오. 이 블로그에는 타사 사이트의 콘텐츠에 대한 링크가 포함될 수 있습니다. 이러한 링크를 제공함으로써 New Relic은 해당 사이트에서 사용할 수 있는 정보, 보기 또는 제품을 채택, 보증, 승인 또는 보증하지 않습니다.


