Amazon Web Services (AWS) announced the GA release of Amazon Managed Service for Grafana (AMG) to add to its Amazon Managed Service for Prometheus (AMP) (in Preview). Both services help you use Prometheus and Grafana for infrastructure monitoring and visualization without the operational burden of managing them. Today’s releases complement New Relic’s announcement last year, when we added support for Prometheus and Grafana within our Telemetry Data Platform.
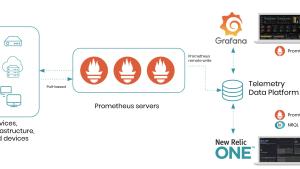
With New Relic and AWS managed solutions, you can use pre-built, community-created Grafana dashboards and built-in metrics instrumentation with an extensible, cost-effective, fully-managed, elastic platform. When you use New Relic, you get all the dashboards and instrumentation combined with the rest of your observability data. In fact, you can use New Relic’s Telemetry Data Platform to consolidate your metric data from all of your Prometheus servers and combine it with your log, event, and distributed trace data, giving you long term storage without the need to manage it. Eliminate the blind spots so you can troubleshoot more effectively. You can even harness powerful AIOps capabilities that reduce mean time to detection and resolution.
If you’re looking to completely offload the task of managing and scaling your Prometheus servers and Grafana instances, then take a look at AMP and AMG.
With AMP, your data collection automatically scales as your workloads grow (or shrink), and it’s integrated with AWS security services to enable fast and secure access to data. Just as you can when self-hosting Prometheus, you can set up New Relic’s Prometheus remote-write integration with AMP. To avoid creating data silos that hinder troubleshooting and analysis, combine the Prometheus data with your metric, event, log, and trace data stored in Telemetry Data Platform.
Similarly, with AMG, you can use Grafana’s powerful open source visualization capabilities and reduce the time to value by leveraging community-created dashboards without having to provision servers, configure and update software, or do the heavy lifting involved in securing and scaling Grafana in production. Configure New Relic as a Prometheus data source for AMG, and you can query your metric data stored in New Relic’s Telemetry Data Platform. By doing so, you can combine data from multiple sources for observability across your entire estate.
We think this is an exciting development for AWS and New Relic customers with existing investments in Prometheus and Grafana!
Get started today
Sign up for New Relic’s free tier, giving you 100 GB of ingest per month and one Full-Stack Observability user license—free forever! Configure the New Relic Prometheus remote-write integration and set up New Relic as a Prometheus data source for Grafana to explore what New Relic can do to bring additional value to these managed open source solutions.
이 블로그에 표현된 견해는 저자의 견해이며 반드시 New Relic의 견해를 반영하는 것은 아닙니다. 저자가 제공하는 모든 솔루션은 환경에 따라 다르며 New Relic에서 제공하는 상용 솔루션이나 지원의 일부가 아닙니다. 이 블로그 게시물과 관련된 질문 및 지원이 필요한 경우 Explorers Hub(discuss.newrelic.com)에서만 참여하십시오. 이 블로그에는 타사 사이트의 콘텐츠에 대한 링크가 포함될 수 있습니다. 이러한 링크를 제공함으로써 New Relic은 해당 사이트에서 사용할 수 있는 정보, 보기 또는 제품을 채택, 보증, 승인 또는 보증하지 않습니다.


