At New Relic, we believe that programmatically tracked service level indicators (SLIs) are foundational to our site reliability engineering practice. When we have programmatic SLIs in place, we lessen the need to manually track performance and incident data. We’re able to reduce that manual toil because our DevOps teams define the capabilities and metrics that define their SLI data, which they collect automatically—hence “programmatic.”
Programmatic SLIs have three key characteristics:
- Current—they reflect the state of our system right now.
- Automated—they’re reported by instrumentation, not by humans.
- Useful—they’re selected based on what a system’s users care about.
In this post, we’ll explain how New Relic site reliability engineers (SREs) help their teams develop and create programmatic SLIs.
Identifying service level indicator capabilities
An important part of creating programmatic SLIs is identifying the capability of the system or service for which you’re creating the SLI. At New Relic, we use the following definitions:
- A system is a group of services and infrastructure components that exposes one or more capabilities to external customers (either end users or other internal teams).
- A service is a runtime process (or a horizontally-scaled tier of processes) that makes up a portion of a system.
- A capability is a particular aspect of functionality exposed by a service to its users, phrased in plain-language terms.
You can create SLIs at any layer, but this post will focus primarily on system-level SLIs.
SLIs and SLOs—indicators and objectives
But first, we need some more definitions. An indicator is something you can measure about a system that acts as a proxy for the customer experience. An objective is a goal for a specific indicator that you’re committed to achieving.
| Indicator | Objective |
| X should be true... | Y portion of the time. |
Configuring indicators and objectives is the easy part. The hard part is thinking through what measurable system behavior serves as a proxy for customer experience. When setting system-level SLIs, think about the key performance indicators (KPIs) for those systems, for example:
- User-facing system KPIs most often include availability, latency, and throughput.
- Storage system KPIs often emphasize latency, availability, and durability.
- Big data systems, such as data processing pipelines, typically use KPIs such as throughput and end-to-end latency.
Your indicators and objectives should provide an accurate snapshot of the impact of your system on your customers.
A more precise description of the indicator and objective relationship is to say that SLIs are expressed in relation to service level objectives (SLOs). When you think about the availability of a system, for example, SLIs are the key measurements of the availability of the system while SLOs are the goals you set for how much availability you expect out of that system. And service level agreements (SLAs) explain the results of breaking the SLO commitments.
| SLI | SLO | SLA |
| X should be true... | Y portion of the time, | or else. |
So, as an example, consider the routing capability of a data-ingest tier. A plain-language definition for the data routing capability might look like: “Incoming messages are available for other systems to consume off the message bus without delay.” With that definition then, we might establish the SLI and SLO as, “Incoming messages are available for other systems to consume off of our message bus within 500 milliseconds 99.xx% of the time.”
Common service level indicator metrics
Service Level Indicators (SLIs) provide insights into the performance and reliability of a service. The choice of SLIs may vary depending on the nature of the service, but here are some common SLI metrics:
| SLI Metric | Definition | Example |
|---|---|---|
| Latency | The time it takes for a request to be processed and a response to be received. | Average latency, 95th percentile latency. |
| Error rate | The percentage of requests that result in errors or failures. | Percentage of HTTP 5xx status codes. |
| Throughput | The rate at which a service can handle incoming requests or transactions. | Requests per second, transactions per minute. |
| Availability | The percentage of time that a service is operational and available for use. | Uptime percentage (e.g., 99.9% uptime). |
| Response time | The time taken to respond to a user request, including both processing and network time. | Round-trip time for a specific operation. |
| Success rate | The percentage of successfully completed transactions or operations. | Percentage of HTTP 2xx status codes. |
| Scalability | The ability of a system to handle increased load or demand while maintaining performance. | Response time under varying levels of concurrent users. |
| Capacity utilization | The percentage of available resources (CPU, memory, storage) being used. | CPU utilization percentage. |
| Incident resolution Time | The time it takes to resolve and recover from incidents or outages. | Mean time to resolution (MTTR). |
| Data consistency | The degree to which data remains accurate and consistent across the system. | Percentage of successful data replication or synchronization. |
| Reliability | The ability of a service to consistently perform its intended function without failures. | Mean time between failures (MTBF). |
| User satisfaction | Metrics related to user feedback, such as ratings, reviews, or Net Promoter Score (NPS). | Customer satisfaction score (CSAT). |
Create programmatic service level indicators (SLIs)
You should write your programmatic SLIs in collaboration with your product managers, engineering managers, and individual contributors who work on a system. To define your programmatic SLIs (and SLOs), apply these steps:
- Identify the system and its services.
- Identify the customer-facing capabilities of the system or services.
- Articulate a plain-language definition of what it means for each capability to be available.
- Define one or more SLIs for that definition.
- Measure the system to get a baseline.
- Define an SLO for each capability, and track how you perform against it.
- Iterate and refine our system, and fine-tune the SLOs over time.
Example capabilities and definitions
Here are two example capabilities and definitions for an imaginary team that manages an imaginary dashboard service:
Capability: Dashboards overview.
Availability Definition: Customers are able to select the dashboard launcher, and see a list of all dashboards available to them.
Capability: Dashboards detail view.
Availability Definition: Customers can view a dashboard, and widgets render accurately and timely manner.
To express these availability definitions as programmatic SLIs (with SLOs to measure them), you'd state these service capabilities as:
- Requests for the full list of available dashboards returns within 100 milliseconds 99.9% of the time.
- Requests to open the dashboard launcher complete without error 99.9% of the time.
- Requests for an individual dashboard return within 100 milliseconds 99.9% of the time.
- Requests to open an individual dashboard complete without error 99.9% of the time.
Automatically set up SLIs and SLOs with New Relic One
Managing all of these service level definitions and visualizations can be difficult if you need to start from scratch. It’s like writing a long paper—it’s always harder to get started when the page is blank.
Luckily, New Relic One’s service level management functionality can help identify SLIs to start measuring and allow you to establish a baseline for SLOs. For example, the tool identifies the most common SLIs for a given service, most often some measurement of availability and latency, and it scans the historical data from a service to determine the best initial setup. Across the platform, you’ll find ways to automatically set up SLIs, like we show here, or you can manually create them with NRQL queries.
If you’re looking for a one-click setup to establish a baseline for SLIs and SLOs in New Relic, just follow these steps:
- Log in to New Relic One and select APM from the navigation menu at the top.
- Select the service entity where you’d like to establish SLIs.
- Then, on the left hand menu, scroll down to the Service Levels option and select it.
- You should see a screen similar to this:
From here, you can simply select the Add baseline service level objectives button and let New Relic One work its magic!
Read the service levels management documentation to learn more about how New Relic One service levels work and how to customize your SLIs and SLOs.
Track all programmatic SLIs in New Relic One
You have a bounty of resources for tracking and measuring your SLIs—an essential part of creating programmatic SLIs. You’ll need to identify existing instrumentation (if any), and deploy instrumentation in your systems and services where it doesn’t already exist. Note that tracking any of your business logic in New Relic One will likely require some kind of custom instrumentation, which allows you to track any interactions that may not already be captured by New Relic's automatic instrumentation.
You’ll take these steps:
- Gather metrics and events (custom or automatic) through instrumentation, and, if your capability involves APIs, run New Relic Synthetic API tests to ensure they behave as expected.
- Create alert conditions that will create a violation if your SLIs exceed their objectives.
- Create New Relic query language (NRQL) queries and New Relic One dashboards that reveal when your services miss their indicators.
Here are three examples of programmatic SLIs set for three systems in a highly simplified version of a system like New Relic One. Each contains a capability definition, a measurement of the SLI (with an SLO), and a NRQL query for creating dashboard widgets and alert conditions.
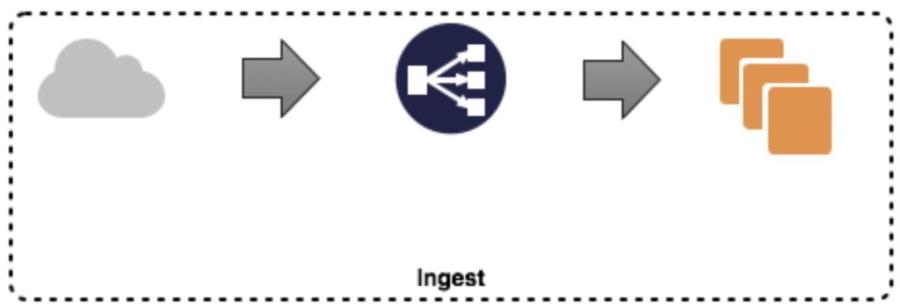
Example 1: Ingest system
Data is sent to an API endpoint, serviced by a load-balancer, to a service that aggregates data by account and publishes to a Kafka topic with an account-based partition scheme, as shown in this diagram:

Capability: Ingest is able to receive data.
Measurement: 99.96% of data is consumed within one minute.
NRQL query:
SELECT percentile(duration, 99.96) FROM ingest_consumer WHERE appName = 'Ingest Production' AND action = ‘processed’
Alert condition: Query result is > 60 at least once in one minute.
SLI queries:
- Valid events:
SELECT count(*) FROM ingest_consumer WHERE appName = ‘Ingest Production’ AND action = ‘processed’ - Good events:
SELECT count(*) FROM ingest_consumer WHERE appName = ‘Ingest Production’ AND action = ‘processed’ AND duration < 99.96
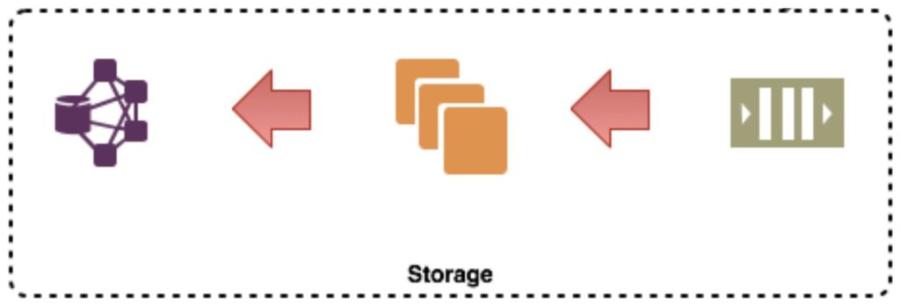
Example 2: Storage system
Data from the Kafka topic is consumed by a service that writes the data to a distributed database, as shown in this diagram:

Capability: Storage writes the incoming data to disk in a timely manner.
Measurement: 99.96% of data is written to disk within 10ms.
NRQL query:
SELECT percentile(duration, 99.96) FROM storage_writer WHERE appName = ‘Storage Production' AND action = ‘write_success’
Alert condition: Query result is > .01 at least once in one minute.
SLI queries:
- Valid events:
SELECT count(*) FROM storage_writer WHERE appName = ‘Storage Production’ AND action = ‘write_success’ - Good events:
SELECT count(*) FROM storage_writer WHERE appName = ‘Storage Production’ AND action = ‘write_success’ AND duration < 99.96
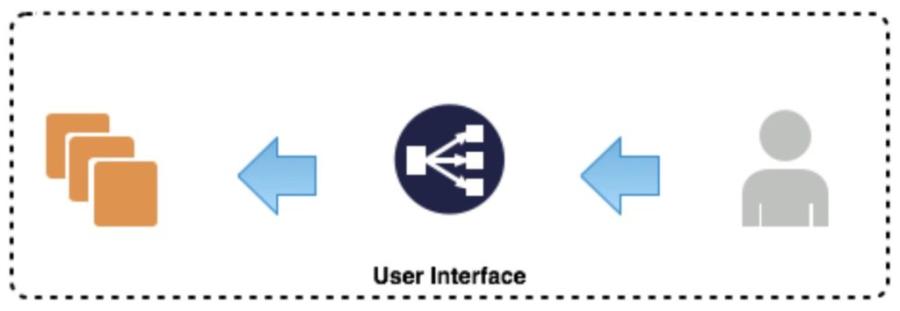
Example 3: User interface
Customers view graphs of their data via a scaled backend that reads data from a distributed datastore, as shown in this diagram:

Capability: Customers are able to login to the user interface and see their data.
Measurement: 99.96% of transactions complete
NRQL query:
SELECT count(*) from SyntheticCheck where result = 'FAILED' and monitorName = 'UI Status Check'
Alert condition: Query result is > one at least once in one minute.
SLI queries:
- Valid events:
SELECT count(*) FROM SyntheticCheck WHERE monitorName = ‘UI Status Check’ - Bad events:
SELECT count(*) FROM SyntheticCheck WHERE monitorName = ‘UI Status Check’ AND result = ‘FAILED’
One size doesn’t fit all SLIs
New Relic SREs spend a great deal of time working with our teams to define their SLIs, but it’s not a one-time process. Modern software systems evolve and change rapidly, so SLIs aren’t something we can set once and forget about.
After you’ve settled on your SLIs, they should be reasonably stable, but systems evolve, and you’ll need to revisit them regularly. It’s a good idea to revisit them quarterly, or whenever you make changes to your services, traffic volume, and upstream and downstream dependencies.
다음 단계
Don’t struggle setting up a baseline for reliability metrics—let New Relic One do the work for you! Read up on all the ways you can easily set up service levels in our documentation or sign up for a free account to dive right in!
An earlier version of this blog post was published in July 2019.
이 블로그에 표현된 견해는 저자의 견해이며 반드시 New Relic의 견해를 반영하는 것은 아닙니다. 저자가 제공하는 모든 솔루션은 환경에 따라 다르며 New Relic에서 제공하는 상용 솔루션이나 지원의 일부가 아닙니다. 이 블로그 게시물과 관련된 질문 및 지원이 필요한 경우 Explorers Hub(discuss.newrelic.com)에서만 참여하십시오. 이 블로그에는 타사 사이트의 콘텐츠에 대한 링크가 포함될 수 있습니다. 이러한 링크를 제공함으로써 New Relic은 해당 사이트에서 사용할 수 있는 정보, 보기 또는 제품을 채택, 보증, 승인 또는 보증하지 않습니다.


