Oracle database architecture has moved from single tenant databases to multitenant databases since the release of version 12c. Multitenant databases include pluggable containers (PDB), which hold tables, and data related to the connecting application; and root containers (CDB), which hold all database health and performance-related information. CDBs are accessed by database administrators while PDBs are of interest to application teams.
In response to the evolving database architecture, New Relic has also adapted its database monitoring integration to be compatible. The recent changes ensure that all the necessary monitoring metrics are made available to application teams and database (DB) admins for observability. Since the release of container databases like Exadata Cloud at Customer (ExaCC) by Oracle, we’ve made changes to our Oracle Database monitoring on host integration to work with the ExaCC databases. This blog post discusses the changes made within the DB landscape and the enhancements to the on-host integration (OHI) to maintain compatibility and to continue providing the same level of monitoring it provided with earlier versions of the database.
What has changed on the database?
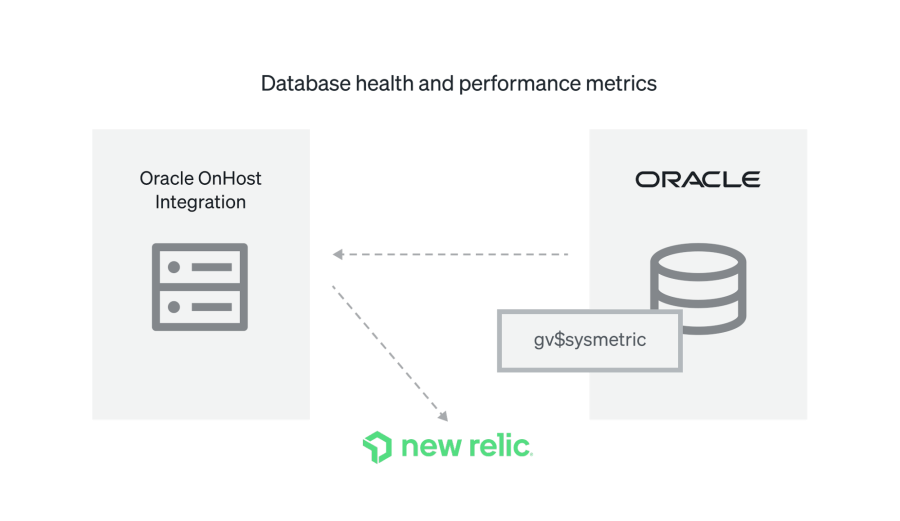
Container databases holds the information for container specific system tables and indexes. Previously, the application database specific information was accessible from gv_$sysmetrics , since Oracle 12c its been moved to gv$con_sysmetric. Now the latter holds information like Session Count, Active Parallel Sessions, Physical Write Bytes Per Sec and a lot more.
What has changed in OHI?
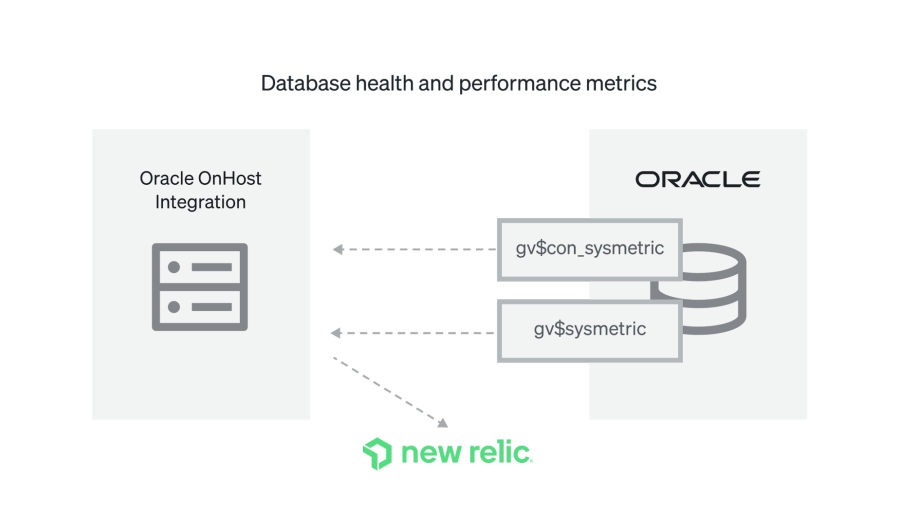
Oracle monitoring has been redesigned to run on both single and multitenant databases by setting the “SYS_METRICS_SOURCE” flag on the configuration file. For the application team, this configuration needs to be set to “PDB,” which will ensure that the integration connects to gv$con_sysmetric. DB administrators can set the configuration to “CDB,” which will allow the integration to interact with gv$sysmetric. For this configuration to be successful, the user needs access to the container indexes, which are described in the next section.
Previously, the New Relic Oracle Database integration did this:

Now, the New Relic Oracle Database integration does this:

Oracle Database OHI setup steps for container databases
- Provision a database user that can be used by the OHI to connect to the database. The user’s container access (PDB or CDB privileges) will be set by the administrator during user creation.
- Provide the user with SELECT privilege to the indexes/views mentioned in step 3 on this link and additionally provide to gv$con_sysmetric.
- Deploy the OHI integration and the oracledb-config.yml to the server with the proper settings. Ensure that “SYS_METRICS_SOURCE” is set according to the data (application database performance or overall system performance) being queried for.
Once the integration has been deployed with the proper user access and configuration settings, the data will be available in the NewRelic platform. All the collected metrics will be available and recorded in the following event types:
- OracleDatabaseSample
- OracleTablespaceSample
What happens now
Once the setup is complete the user can log in to the New Relic platform. On logging in, the Oracle database being instrumented will appear under the “Oracle databases” section on the “All Entities” page. By clicking on those database names, you’ll be directed to the curated views that show the database performance metrics. Additionally, you can view metrics in the Data Explorer section or even query using New Relic Query Language (NRQL).
Conclusion
We’re continuously developing our integrations to provide the instrumentation capabilities that our customers need to achieve full-stack observability. The database architecture changes are aimed at providing access to metrics relevant to the respective realms of application teams as well database administrators while keeping the metrics isolated so that only authorized data is accessible.
다음 단계
Oracle Database on-host integration requires a New Relic infrastructure agent for functioning. The configuration details for setting up the integration is available in official documentation linked here.
If you have a free New Relic account, you can set up the infrastructure agent and the integration to start seeing your Oracle database performance metrics on the New Relic platform. To learn more, contact your New Relic account representative and get started.
Don’t have a New Relic account yet? Sign up for free today. Your free account includes 100 GB/month of data ingest and one full user.
이 블로그에 표현된 견해는 저자의 견해이며 반드시 New Relic의 견해를 반영하는 것은 아닙니다. 저자가 제공하는 모든 솔루션은 환경에 따라 다르며 New Relic에서 제공하는 상용 솔루션이나 지원의 일부가 아닙니다. 이 블로그 게시물과 관련된 질문 및 지원이 필요한 경우 Explorers Hub(discuss.newrelic.com)에서만 참여하십시오. 이 블로그에는 타사 사이트의 콘텐츠에 대한 링크가 포함될 수 있습니다. 이러한 링크를 제공함으로써 New Relic은 해당 사이트에서 사용할 수 있는 정보, 보기 또는 제품을 채택, 보증, 승인 또는 보증하지 않습니다.


