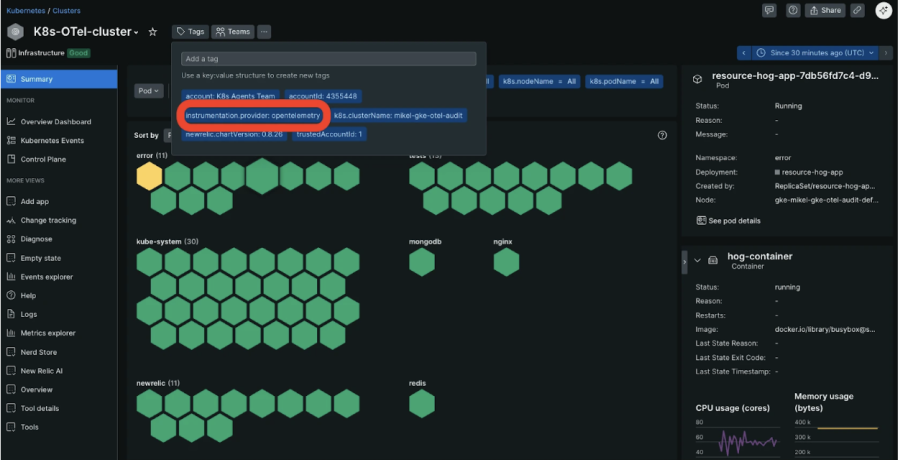
Modern Kubernetes environments are dynamic and complex, often comprising hundreds or thousands of ephemeral services and workloads. While Kubernetes-native observability tools provide some visibility, developers and operators frequently lack the contextual insights necessary to correlate service performance with infrastructure events, deployment changes, or network bottlenecks.
Today, we’re announcing the preview release of Kubernetes Monitoring with OpenTelemetry—a significant step forward in open, scalable, and frictionless observability for cloud-native environments.
This new capability combines OpenTelemetry Collector metrics, events and logs with Kubernetes metadata in a single, curated New Relic experience. It enables teams to quickly diagnose performance anomalies across pods, services, nodes, and namespaces without writing a single line of instrumentation code.
Kubernetes Monitoring with OpenTelemetry helps improve detection, troubleshooting, and collaboration across DevOps, SRE, and platform teams—without requiring the installation of additional agents or custom exporters and with an unified view, you no longer need to piece together disparate views from Grafana, kubectl, and CloudWatch.

Key capabilities include:
- Zero-Code, OpenTelemetry-Native Instrumentation: Automatically collects pod, node, and container metrics/logs with OpenTelemetry Collector—no manual setup required.
- Unified Observability in One Place: Correlate logs, metrics, events and metadata (CPU, memory, pod name, etc.) across your Kubernetes workloads—no need to jump between kubectl, CloudWatch, or Grafana.
- Faster Troubleshooting with Curated Dashboards: Instantly visualize container health, pod restarts, alert status, and more—plus, drill into related APM services and logs without context-switching.
- Future-proof your observability investment: Built on OpenTelemetry and Prometheus to ensure flexibility and avoid vendor lock-in with Open Standards.
- Enterprise-Grade OTel Scalability: Handles high-cardinality data at scale with cost-efficient processing—perfect for large clusters, multi-tenant setups, and modern CI/CD workflows.
How to Get Started
You can get started with just a few steps:
- Install the OpenTelemetry Collector on your Kubernetes cluster.
- Use the New Relic Helm chart to deploy the Kubernetes monitoring pipeline.
- Configure your license key and cluster name in the Helm values file.
- Select Kubernetes dashboards in New Relic under APM & Services > Kubernetes Monitoring.
다음 단계
Ready to reduce blind spots in your Kubernetes environment?
Try Kubernetes Monitoring with OpenTelemetry now in preview:
Read the documentation →
Don’t have New Relic yet? Sign up for free and — includes 100 GB/month of free data ingest, unlimited free basic users, and immediate access to New Relic’s Open Telemetry tool for Kubernetes Monitoring.
이 블로그에 표현된 견해는 저자의 견해이며 반드시 New Relic의 견해를 반영하는 것은 아닙니다. 저자가 제공하는 모든 솔루션은 환경에 따라 다르며 New Relic에서 제공하는 상용 솔루션이나 지원의 일부가 아닙니다. 이 블로그 게시물과 관련된 질문 및 지원이 필요한 경우 Explorers Hub(discuss.newrelic.com)에서만 참여하십시오. 이 블로그에는 타사 사이트의 콘텐츠에 대한 링크가 포함될 수 있습니다. 이러한 링크를 제공함으로써 New Relic은 해당 사이트에서 사용할 수 있는 정보, 보기 또는 제품을 채택, 보증, 승인 또는 보증하지 않습니다.


