Working with complex and distributed technologies in modern software environments can be challenging. Our Complexity in Context video series is designed to give you a clear, hands-on understanding of how to use New Relic to cut through that complexity.
This inaugural episode delves into how observability has changed as modern software has evolved from monolith applications to microservices-based environments. We also walk through an example of how to use New Relic to troubleshoot performance issues in microservices environments in four steps:
- Get an overall view of application performance
- Use distributed tracing to drill down into performance issues
- Use benchmarking to identify anomalous spans
- Gather detailed data to fix performance problems
You can read through the steps, and then watch the entire 4-minute video embedded at the end of this post.
The evolution of observability
To begin, it's helpful to review the key differences between a modern, microservices application architecture and a legacy monolithic application—and especially how these differences impact the way you identify and troubleshoot application performance issues.
When working with a monolithic application, it’s important to look deep into a system, down to the code level. That’s the only way for developers to understand the application's internals.
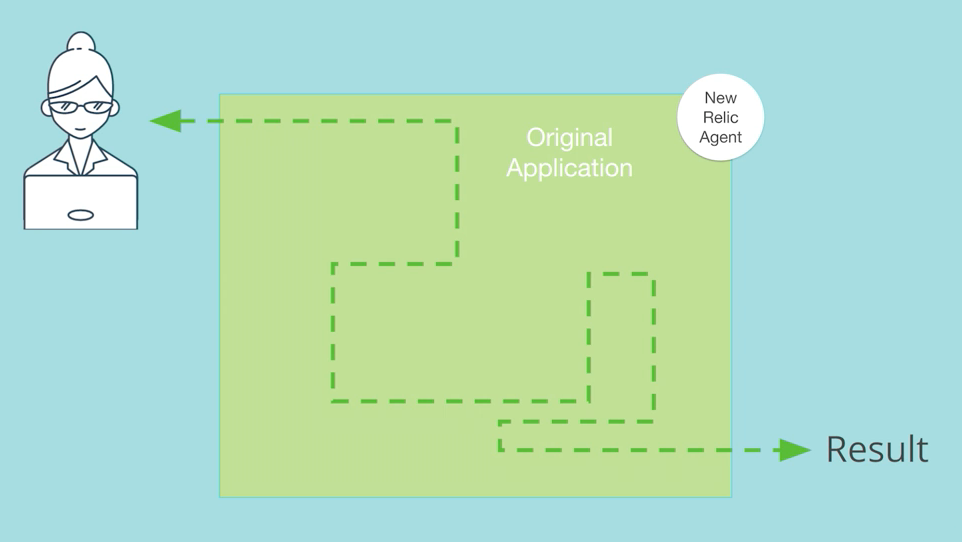
In contrast, with a microservices environment, you may be dealing with dozens or even hundreds of services. There are countless ways for these services to call one another and for requests to flow through multiple services in these environments. Seeing how those services connect together and how your requests flow through a specific combination of services, as illustrated in the following image, is a lot more important in microservices environments:
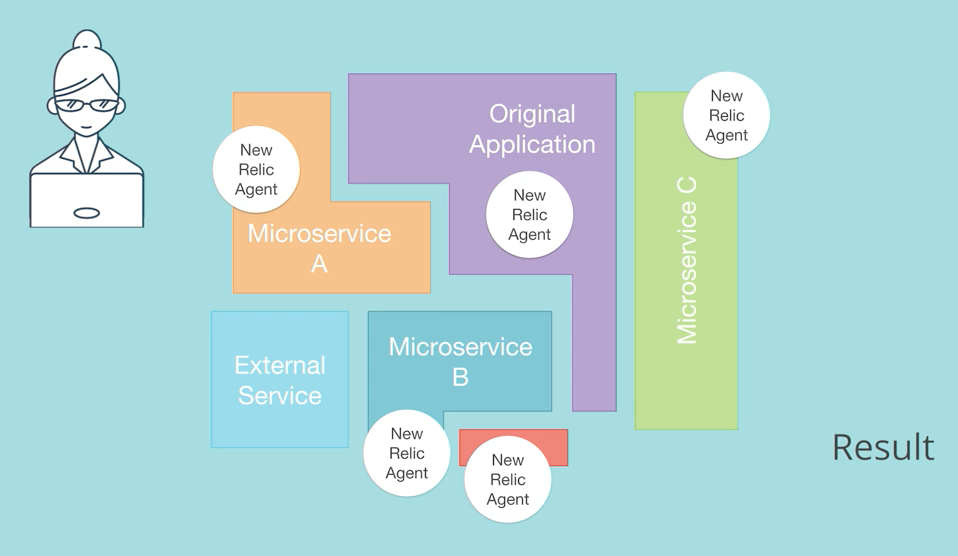
Understanding how requests flow through these complex, distributed environments can be challenging. But you need to untangle this complexity in order to diagnose and fix performance issues quickly and accurately.
In addition, in many cases, different teams own and maintain different services within a distributed application. Unless you know which services are involved in a performance issue, it can be very difficult to identify which team should take the lead in fixing it.
New Relic can help cut through this complexity, so you can understand the relationships between services and how they're performing, and uncover the source of performance issues.
Let's look at exactly how it's done.
Step One: Get an overall view of application performance
For this example, start with a hypothetical scenario: You’ve just joined the team working on a web portal service at a telecom company. The support team informs you that customers are complaining about intermittent slowness on the web portal service—specifically, on the page where customers select a mobile phone for their service.
The first step is to look at the big picture for how the web portal service works with all the other services in the environment. The New Relic APM service map shows you an comprehensive topology for how everything fits together:
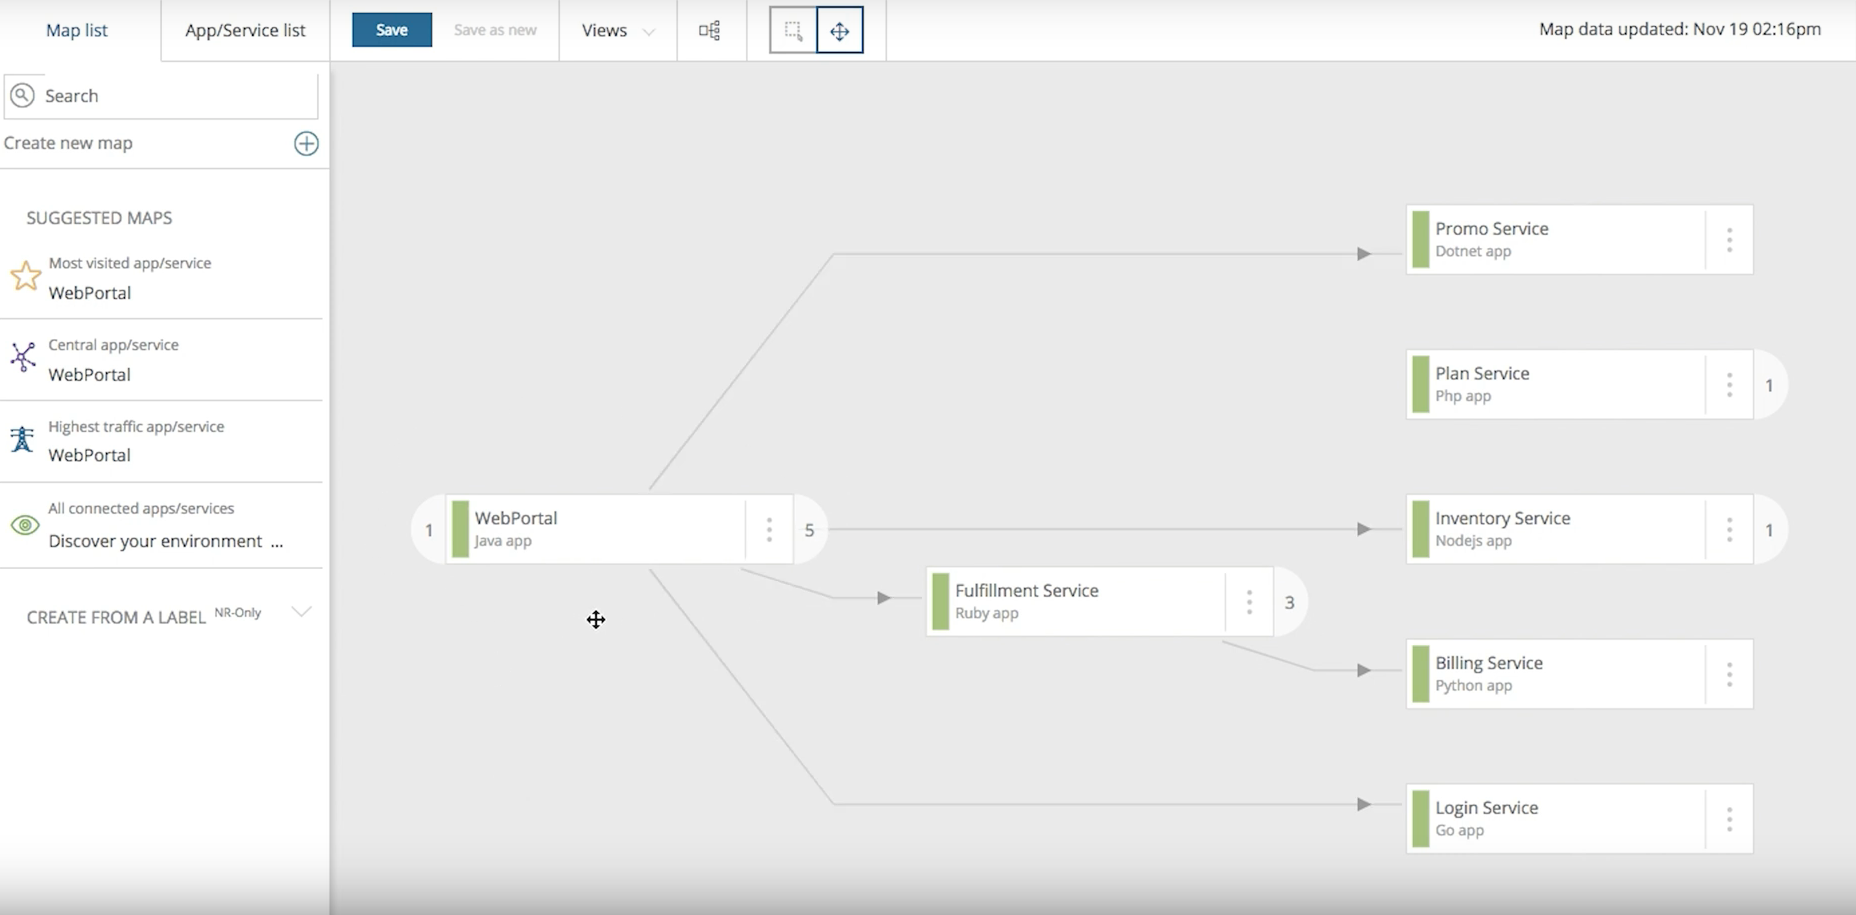
The service shows that the web portal service connects to a number of different services, including a login service and fulfillment service. It also reveals a polyglot environment: The web portal service is in Java, for example, while the login service is in Go, and the fulfillment service is in Ruby.
In addition, selecting any of the services visible on the service map presents a quick overview of its response time, Apdex, and other performance metrics:
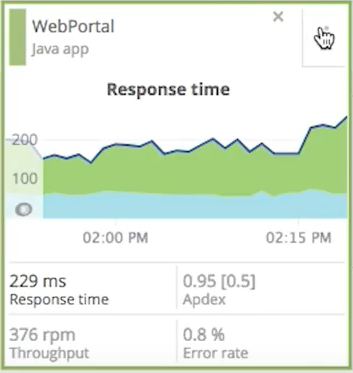
Once you understand which services impact the web portal service and the connections between these services, your next step is to drill down into the environment and begin your search for the problem that's behind the customer complaints.
Step Two: Use distributed tracing to drill down into performance issues
Begin the troubleshooting process by looking at some of the requests that go through the "phones" page, and find a request that looks unusually slow.
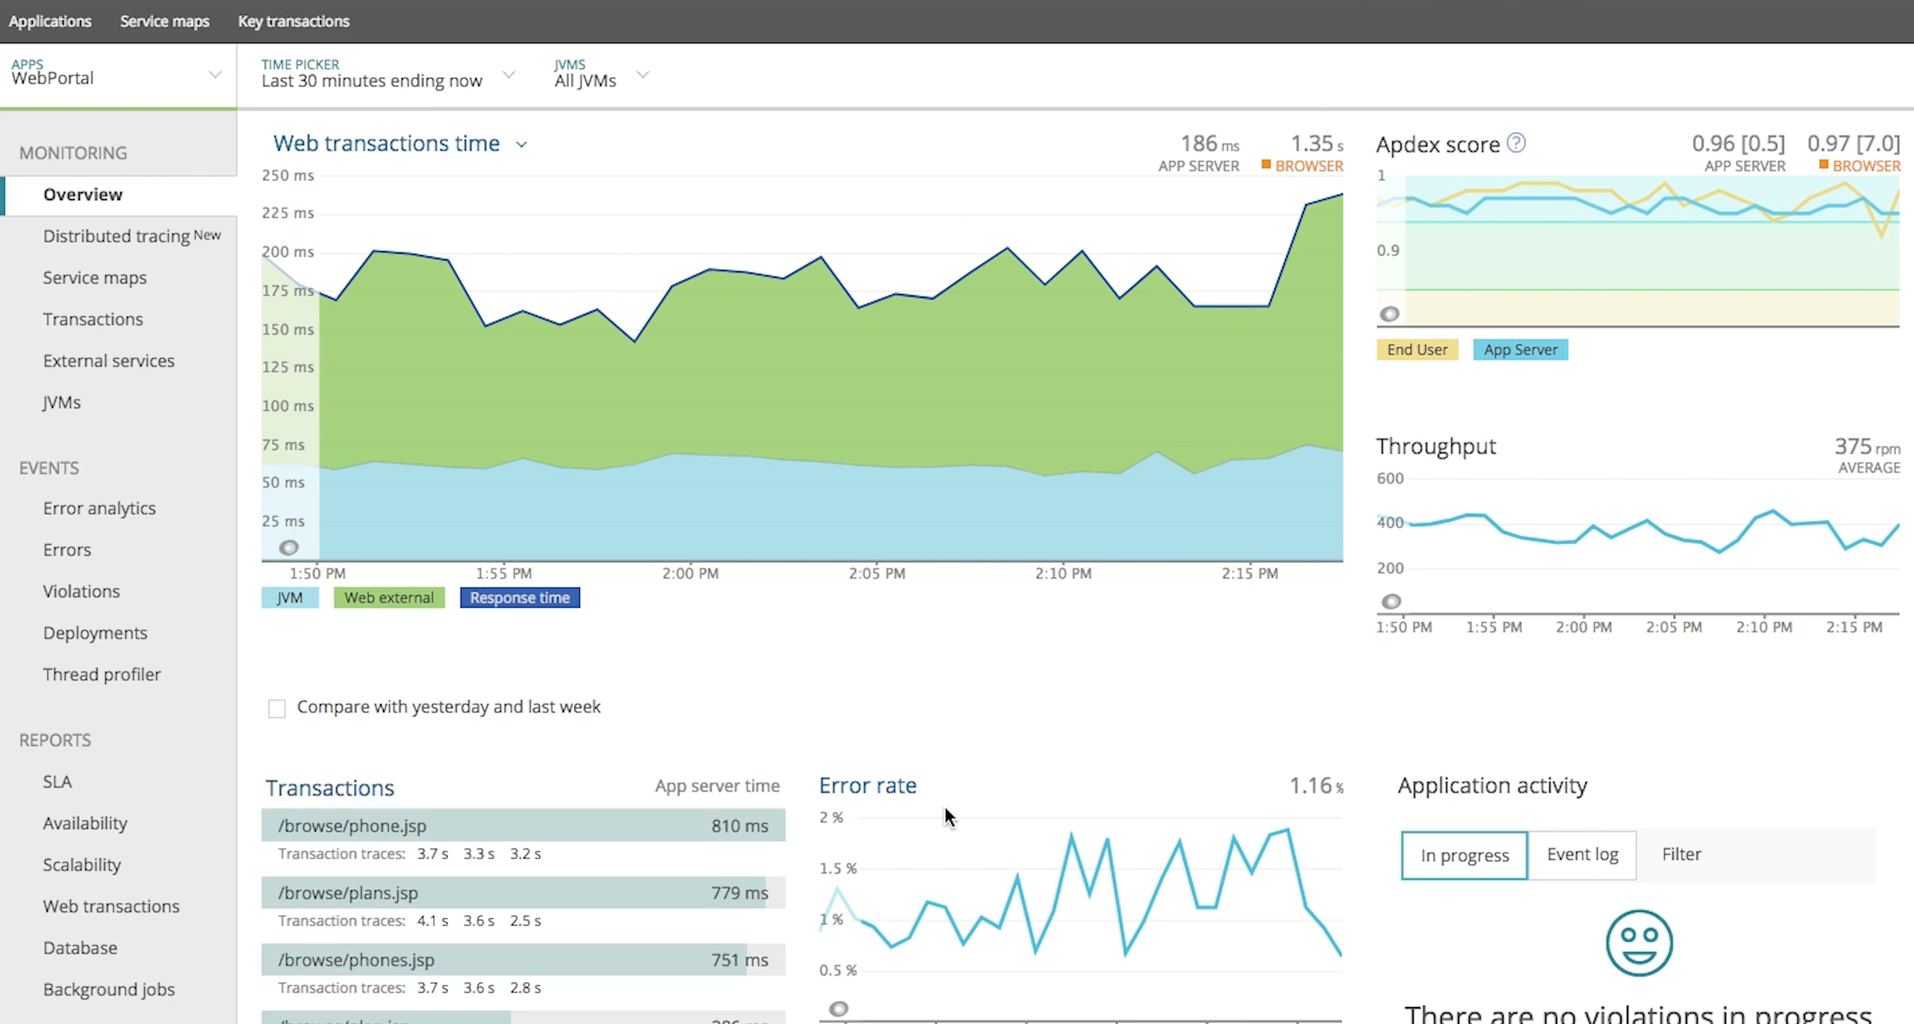
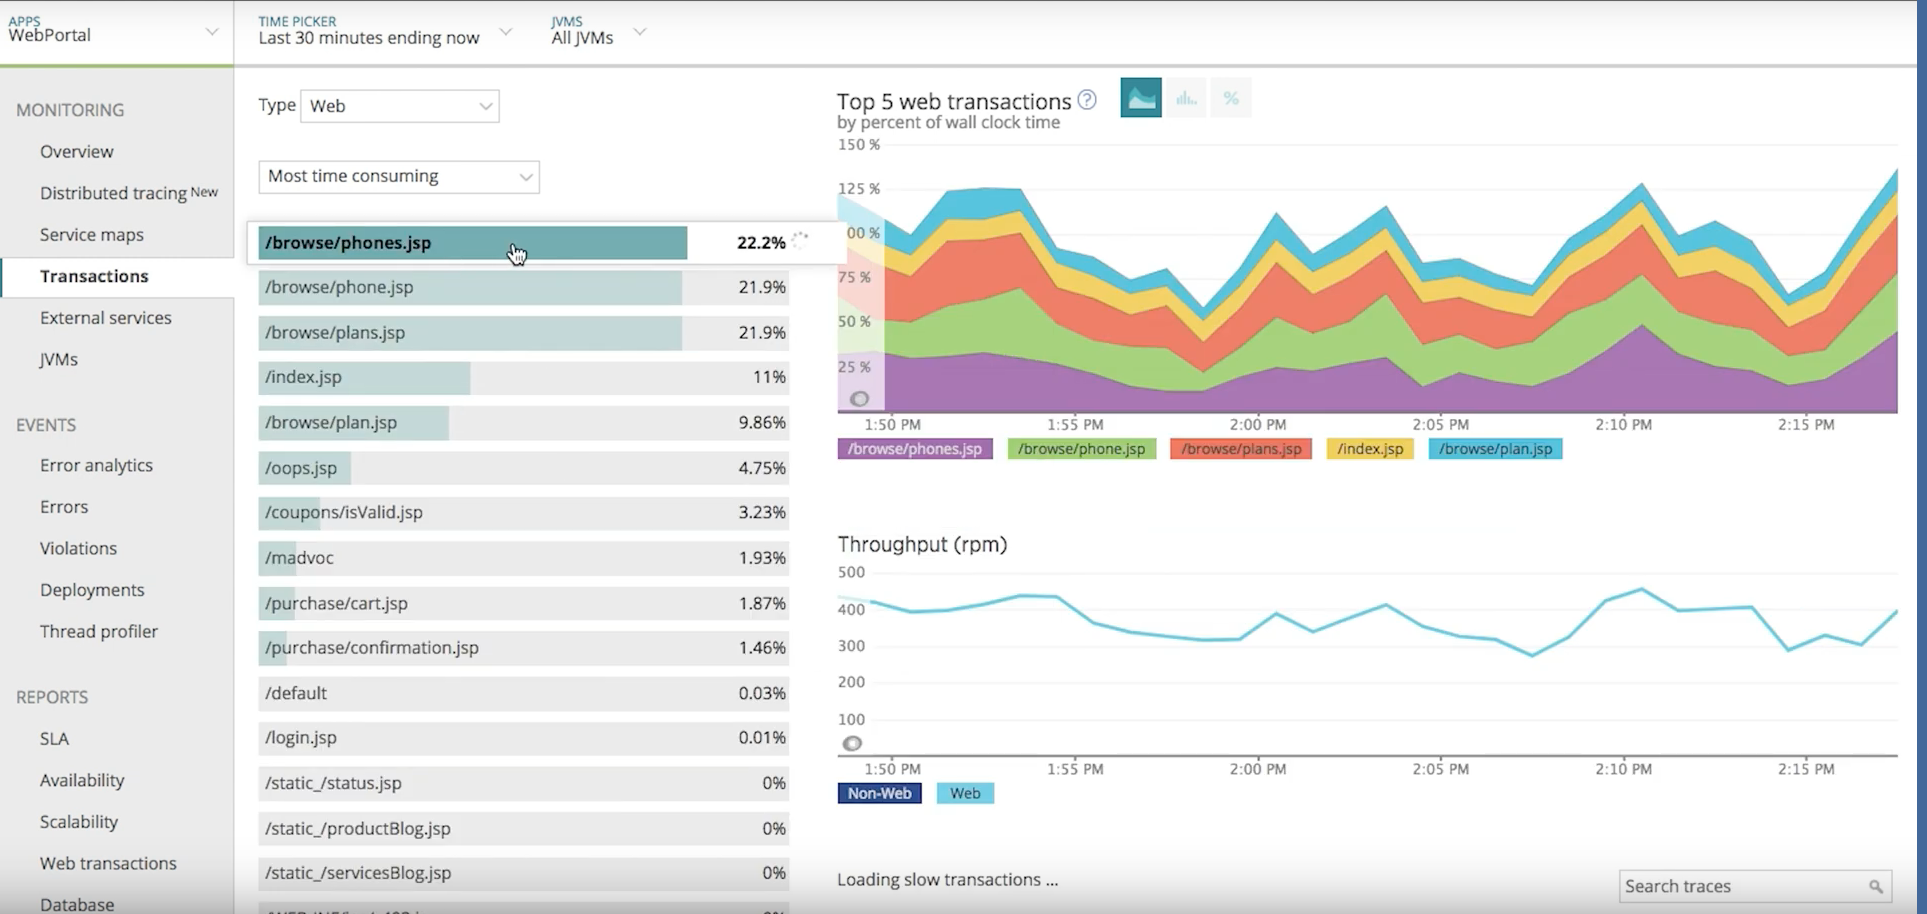
First, use New Relic APM to see a list of all the transactions flowing through this page:
In general, this data indicates that the "phones" page on the web portal is performing well, but it’s worth taking a closer look and reviewing some traces that may reveal slow requests that require troubleshooting:
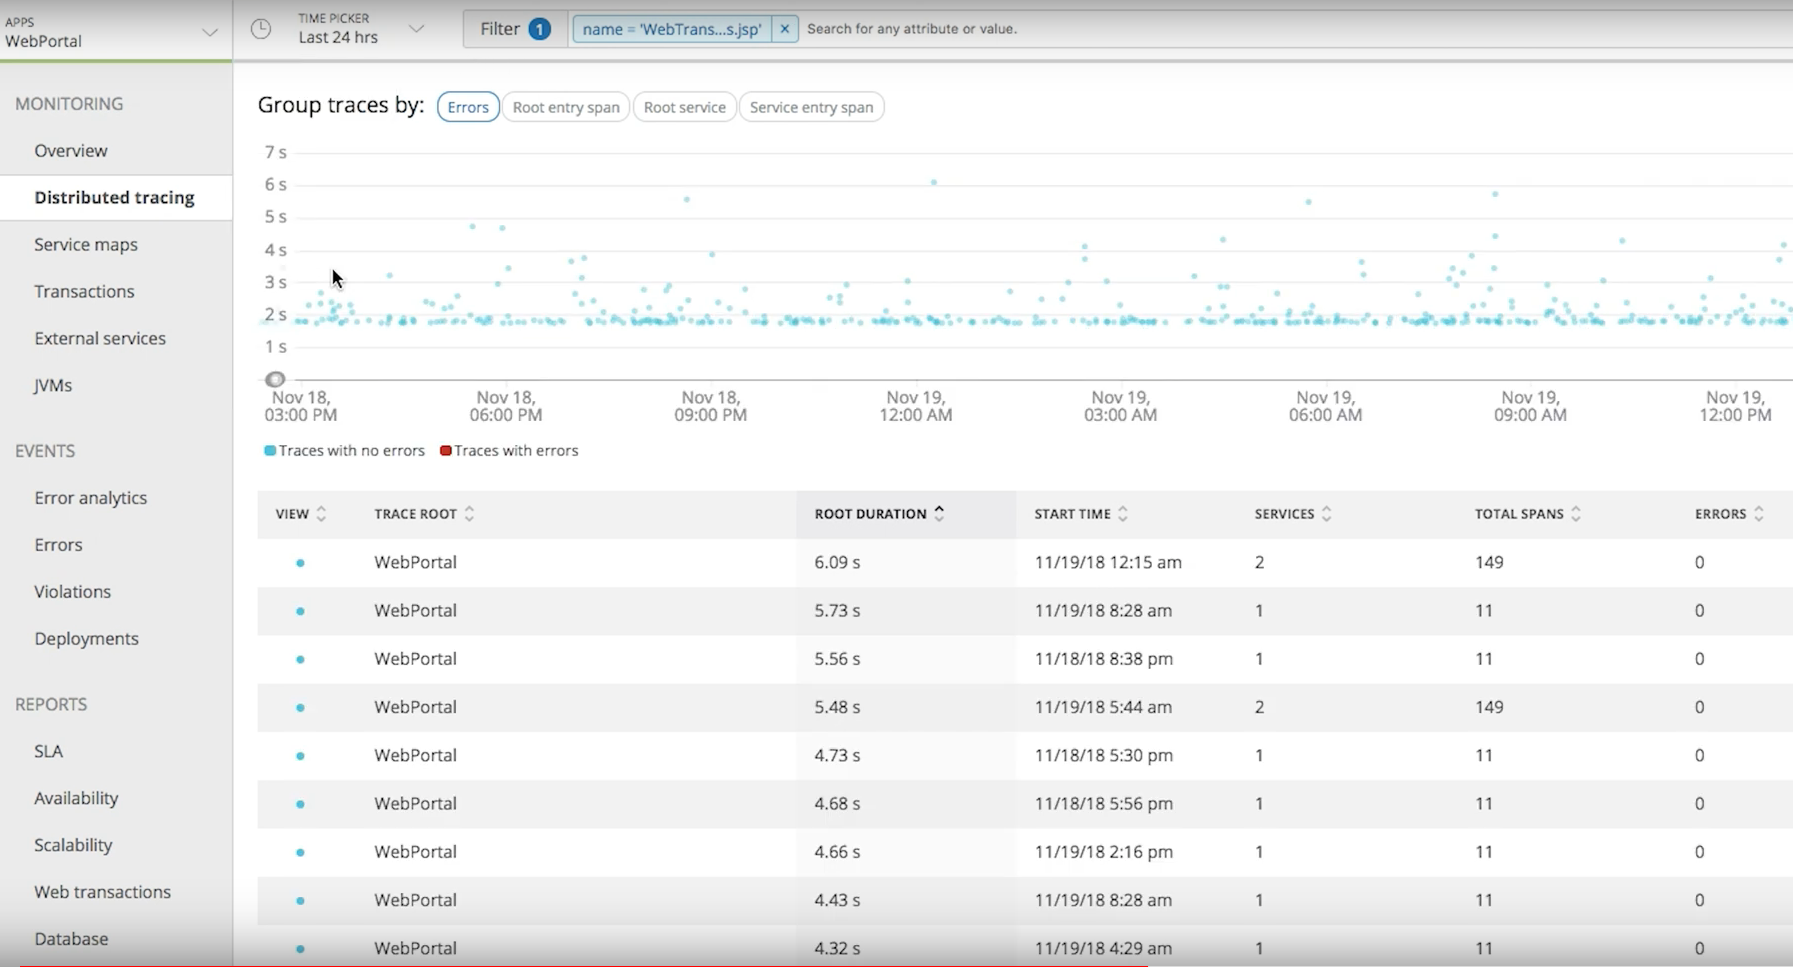
Click into the distributed traces for this page, and you’ll see that it has already filtered the traces to show just the set that's relevant to the "phones" page on the web portal:
Bingo! You’ve found some unusually slow requests. Select one of them, as shown here, to look into what might be happening:
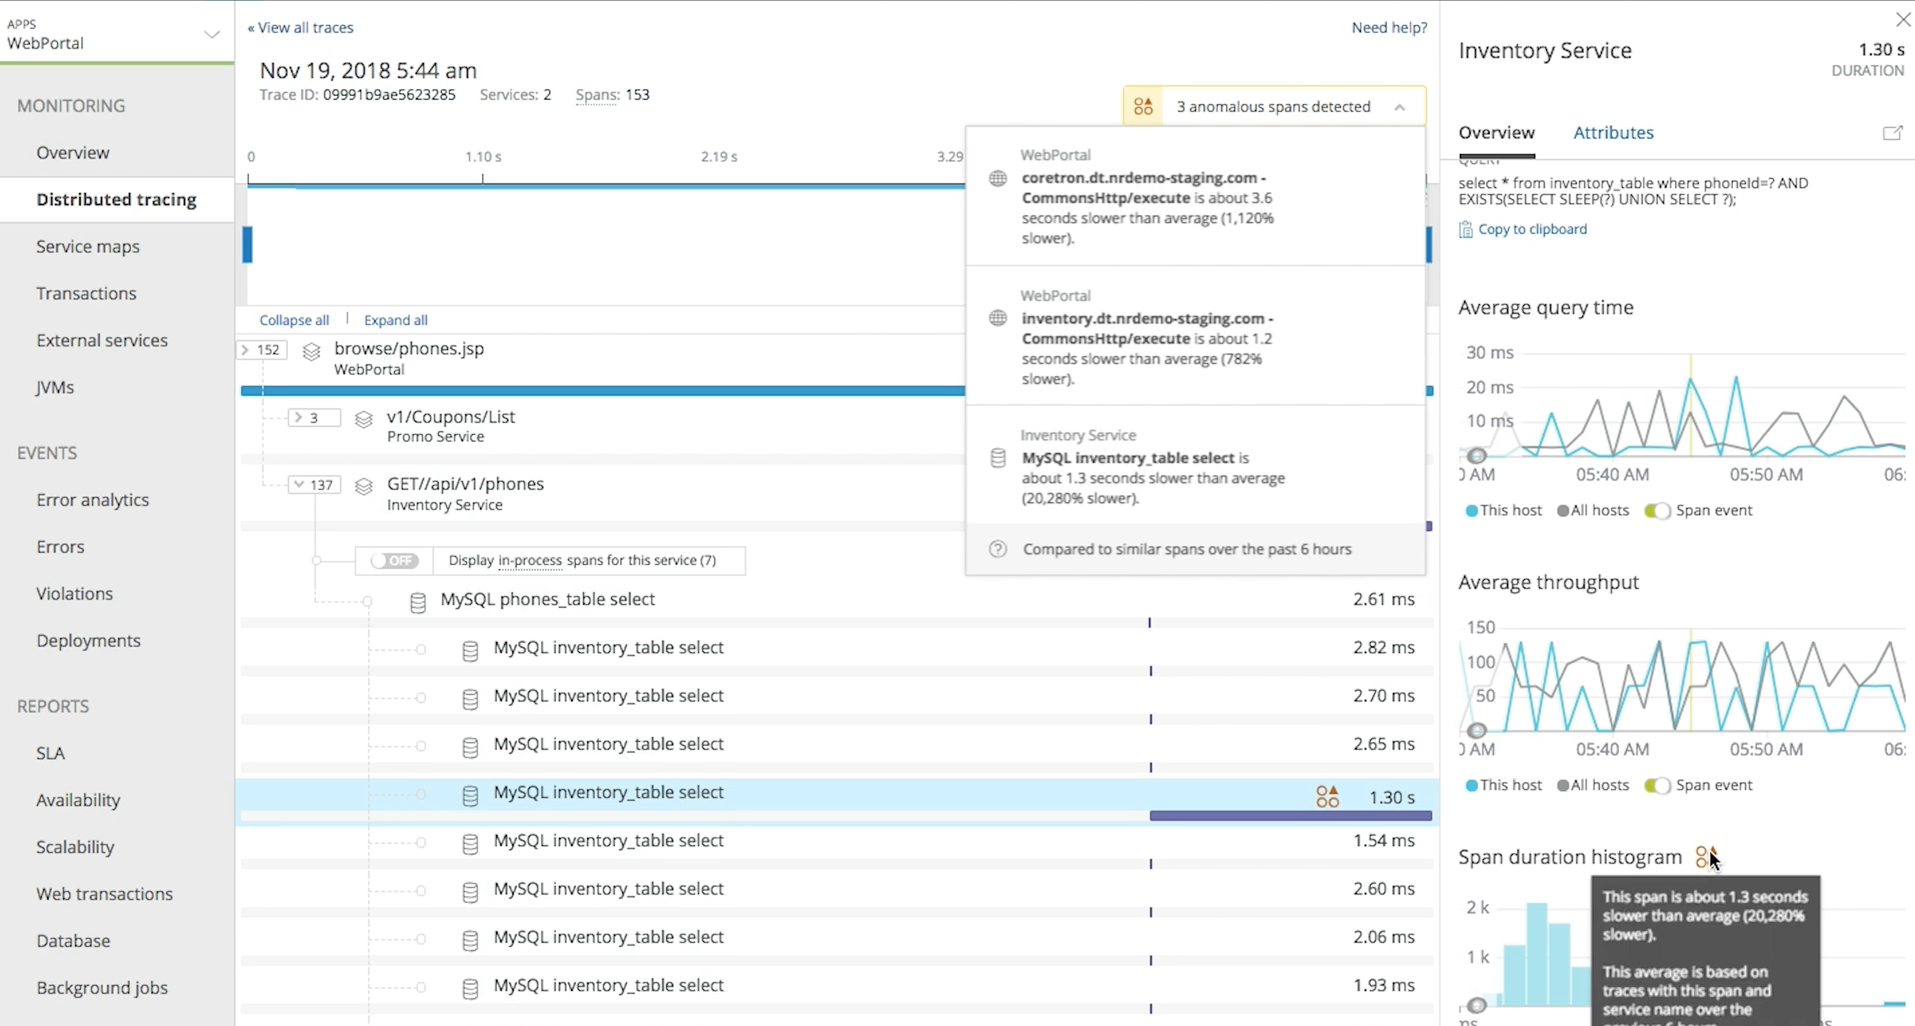
When you get a detailed view of the selected request, as shown below, you can see that the request started off in the web portal service, then it went to the promo service and finally to inventory service. Note the top right corner of this screen shot, where New Relic APM has flagged this request as having some anomalous spans:
Step Three: Use benchmarking to identify anomalous spans
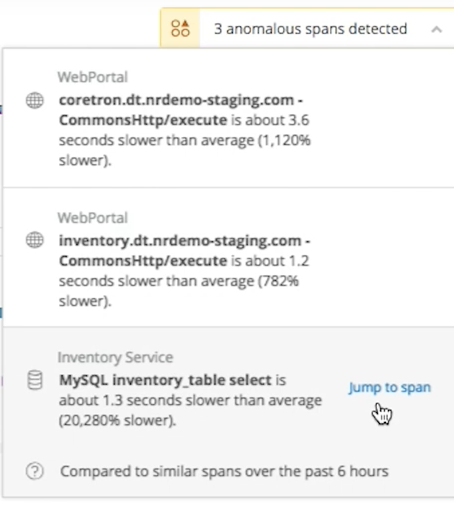
New Relic APM helps identify spans with performance issues by benchmarking them against other similar spans over a specified interval—in this case, six hours. (You can change the duration of the benchmarking interval as needed.)
Clearly, some of these spans are running a lot slower than normal, based on the benchmarking data. In fact, it looks like there's a major bottleneck associated with the database that may be causing performance issues:
Step Four: Gather detailed data to fix the performance problem
Diving deeper, you move from a high-level view of system performance to a much more detailed drill-down view, which reveals a possible performance issue. You then track down the source of the problem, using benchmarking data to get a clear picture of normal versus abnormal performance.
Now it’s time to look for additional information about what might be causing the problem. You can get this by jumping straight into the span that's being flagged for slow performance:
Based on the data that New Relic APM is providing about the span, it looks like there's a N+1 query associated with the inventory service that's causing the performance issues.
Even if you don’t own the inventory service in our example scenario, New Relic has given you enough information to contact the relevant team and to brief them on exactly what's causing the problem and where to look in order to fix it.
A better way to find and fix performance issues
New Relic makes it much easier to find and fix performance issues in complex microservices environments. In our example, distributed tracing enabled you to identify a particular service and drill down to an anomalous span, to confirm a performance issue by benchmarking a span's performance, and even to identify the likely cause of the problem (a major bottleneck associated with the inventory service database) so you can give the owners of that service a good head start on fixing it.
By giving you a better understanding of your services and how they work together, New Relic makes it easier ensure that your systems and teams are working together smoothly. To learn more, check out the Introduction to distributed tracing in the New Relic documentation, see How New Relic distributed tracing works, and watch the video below:
이 블로그에 표현된 견해는 저자의 견해이며 반드시 New Relic의 견해를 반영하는 것은 아닙니다. 저자가 제공하는 모든 솔루션은 환경에 따라 다르며 New Relic에서 제공하는 상용 솔루션이나 지원의 일부가 아닙니다. 이 블로그 게시물과 관련된 질문 및 지원이 필요한 경우 Explorers Hub(discuss.newrelic.com)에서만 참여하십시오. 이 블로그에는 타사 사이트의 콘텐츠에 대한 링크가 포함될 수 있습니다. 이러한 링크를 제공함으로써 New Relic은 해당 사이트에서 사용할 수 있는 정보, 보기 또는 제품을 채택, 보증, 승인 또는 보증하지 않습니다.

