Quickstart
Why monitor webpy?
webpy is a web framework for Python that is as simple as it is powerful. It offers useful debug features and automatically reloads after code changes. Integrate New Relic’s Python agent with your webpy app to monitor your app’s performance metrics in real time.
webpy quickstart highlights
The New Relic webpy quickstart has the following features:
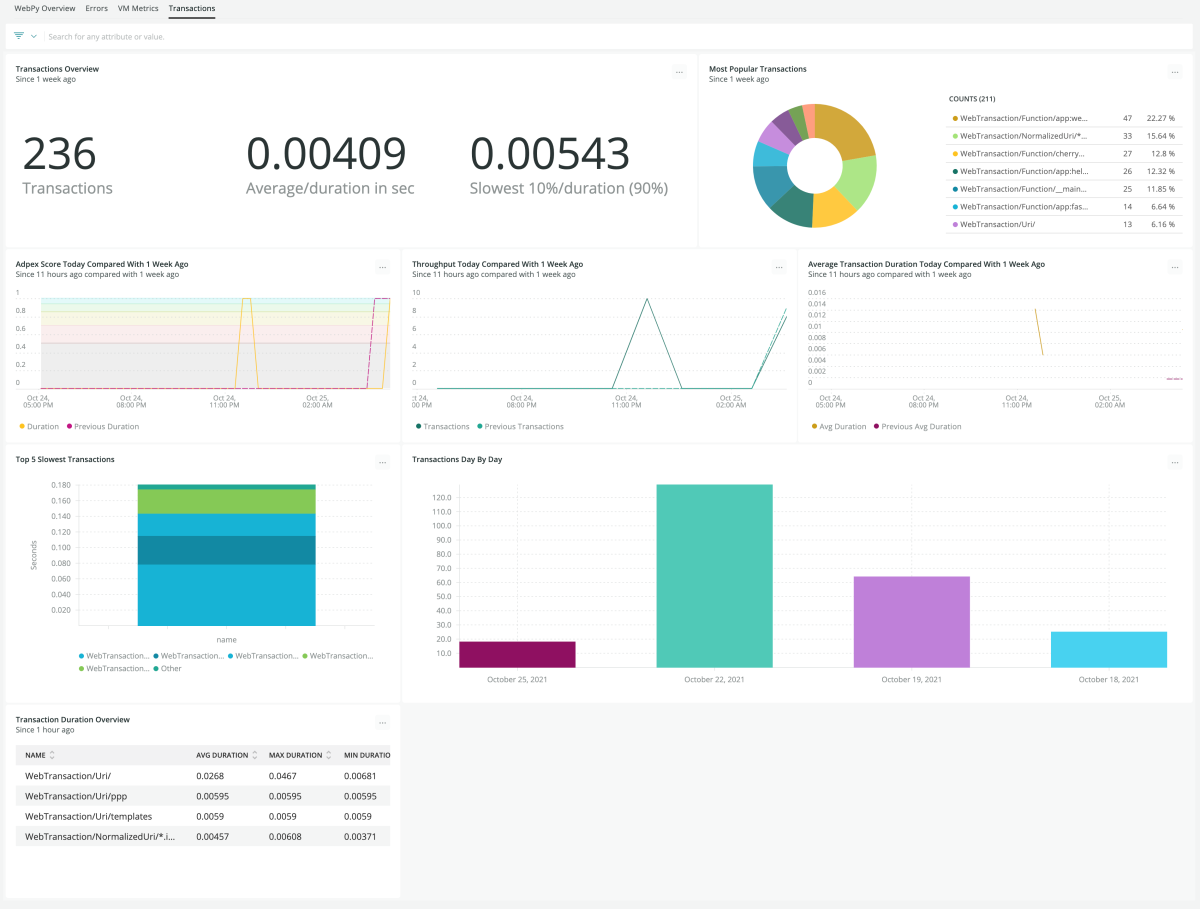
- Dashboards: Our dashboards provide you a clear overview of transactions, errors, and the virtual machine. The dashboards also help you monitor other key indicators like top 10 failed transactions, latest errors, and more.
- Alerts: Get instant alerts like Apdex score, memory usage, high CPU utilizations, and transaction errors.
New Relic + webpy = Optimum performance monitoring
New Relic’s webpy quickstart automatically instruments your webpy app with the New Relic Python agent and allows you to monitor your Python application with practical dashboards and alerts. In particular, the dashboards provide you with interactive visualizations to easily explore your data, understand context, and resolve issues faster. With flexible options for custom instrumentation and APIs, our Python agent offers multiple building blocks for you to create and share customized dashboards.
Monitoring webpy with New Relic’s Python agent provides instant alerts on Apdex score and transaction errors. You can track key transactions, examine database query traces, and get a high-level summary of your app’s performance. You also have the ability to view logs and infrastructure data as well as bring them together to make troubleshooting easier and more efficient.
Install the New Relic webpy quickstart to effectively monitor your webpy app’s performance metrics with our Python agent. This quickstart gives you the tools to address issues that may arise when using webpy.
Need help? Visit our Support Center or check out our community forum, the Explorers Hub.

