Quickstart
How to monitor NGINX with New Relic?
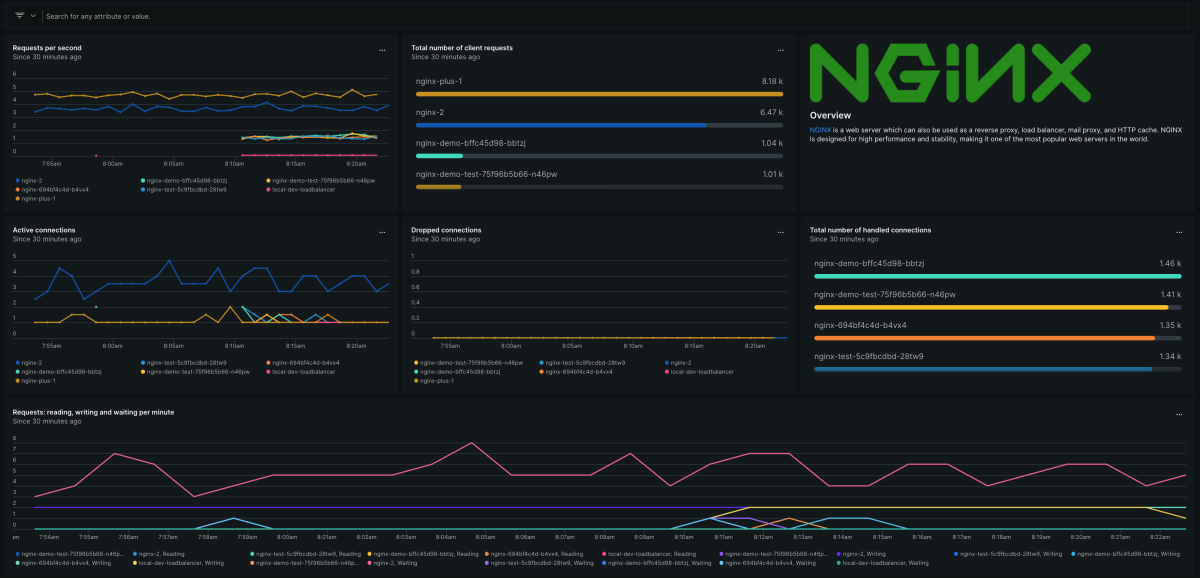
The OpenTelemetry nginxreceiver collects metrics from your running NGINX instances. These metrics provide insights into connections, requests, client errors, server errors, and more. A New Relic entity will be created for each NGINX instance, allowing you to easily explore, configure alerts, and compare metrics for all your NGINX servers in one place. Our monitoring quickstart includes a pre-built dashboard that displays aggregated metrics from all of your NGINX instances, with the ability to filter the data for specific analyses.
Why monitor NGINX with New Relic?
New Relic NGINX for OpenTelemetry quickstart gives you comprehensive visibility into your NGINX web servers alongside your apps and server infrastructure. Monitoring NGINX is vital to obtain real-time performance metrics for web servers across your entire environment. This ensures optimal server operations, leading to better application performance and enhanced user experiences.
Need help? Visit our Support Center or check out our community forum, the Explorers Hub.

