Quickstart
Why monitor Flask?
Flask is a Python web application micro-framework built with a focus on simplicity. It provides developers the freedom to build the structure of a web application. New Relic Flask Quickstart empowers you with dashboards and alerts to effectively monitor Flask’s performance metrics like transaction errors, CPU utilization, apdex score, and many more.
Flask quickstart highlights
The New Relic Flask quickstart has the following features:
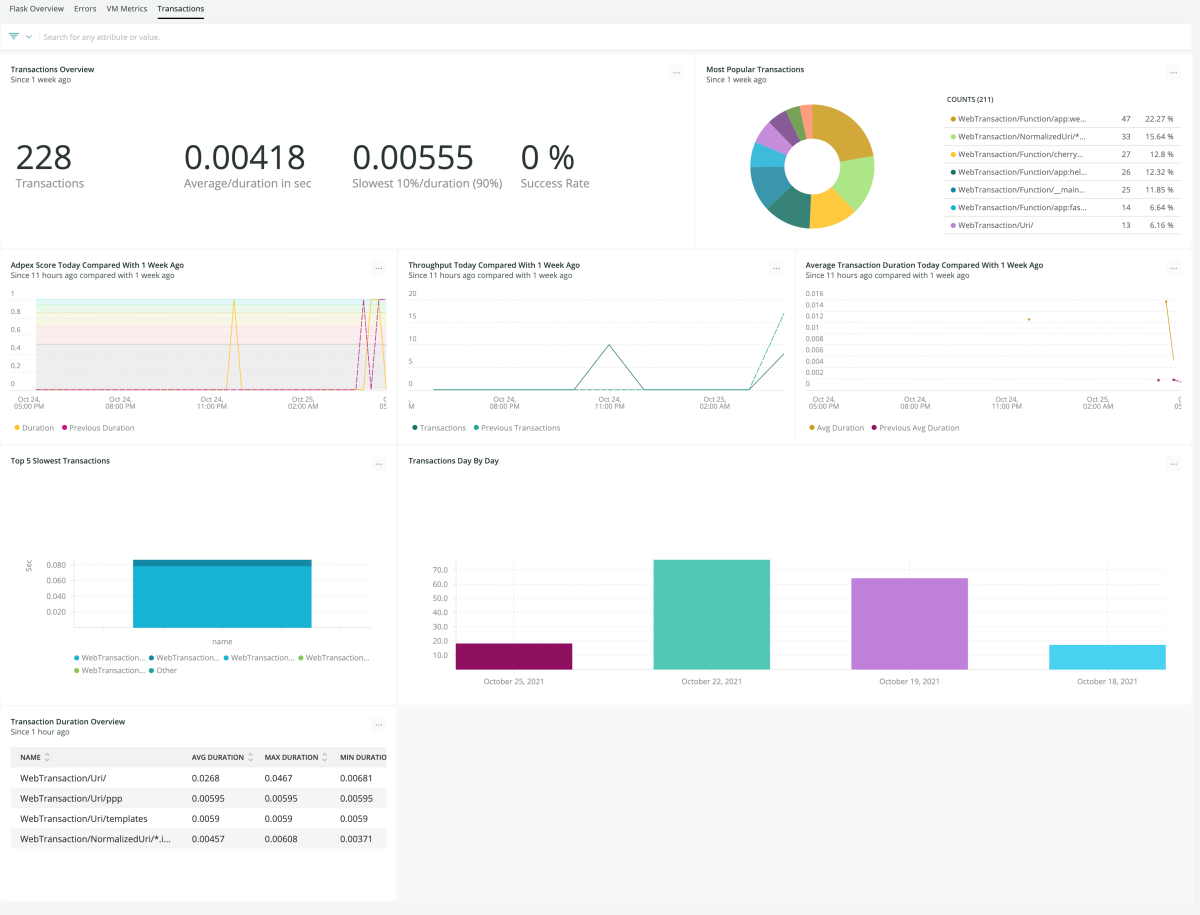
Dashboards
- CPU Utilization
- memory heap used
- garbage collection
- CPU time
- top 5 slowest transactions
- throughput reports
- most popular transactions and more
Alerts
- apdex score
- cpu utilization
- transaction error
New Relic + Flask = Optimum performance monitoring
The New Relic Flask quickstart automatically instruments Flask with the New Relic Python agent, and instantly monitors your application with out-of-the-box dashboards and alerts. The dashboards provide interactive visualizations to explore your data, understand context, and resolve problems faster. The Python agent allows you to leverage all our platform to customize the data you need from your app.
The integration monitors Flask’s performance metrics like apdex (user satisfaction), CPU utilization and transaction errors. With the integration, you can track key transactions specific to your business, create custom dashboards, and get alerts for any error. You can also query business data to get more insights and use thread profiler sessions to see detailed stack traces of sampled threads.
Install the New Relic Flask Quickstart now to monitor Flask’s endpoints and key performance indicators efficiently. It strengthens you to keep developing seamless web apps.
Need help? Visit our Support Center or check out our community forum, the Explorers Hub.

