Por el momento, esta página sólo está disponible en inglés.
 / 
Django

Django

Monitoring Django is critical to ensure that you detect incidents and respond to them quickly. Download the New Relic Django quickstart to proactively track your Django’s performance metrics via New Relic’s Python agent.

What's included?

dashboards
1
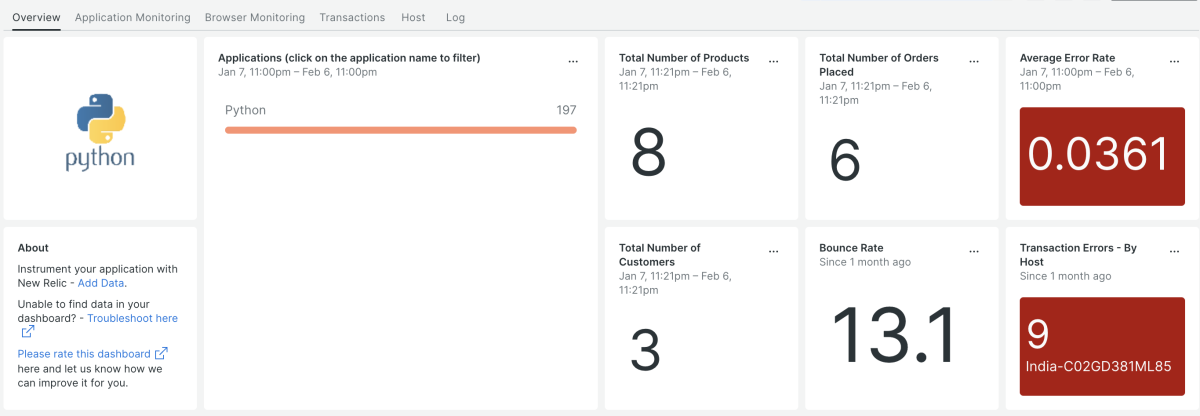
Django quickstart contains 1 dashboard. These interactive visualizations let you easily explore your data, understand context, and resolve problems faster.
alerts
3
Django observability quickstart contains 3 alerts. These alerts detect changes in key performance metrics. Integrate these alerts with your favorite tools (like Slack, PagerDuty, etc.) and New Relic will let you know when something needs your attention.
High CPU Utilization
This alert is triggered when the CPU Utilization is above 90%.
Transaction Errors
This alert is triggered when the the transactions fail more than 10% of the time in 5 minutes.
Apdex Score
This alert is triggered when the Apdex score is below 0.5 for 5 minutes
documentation
1
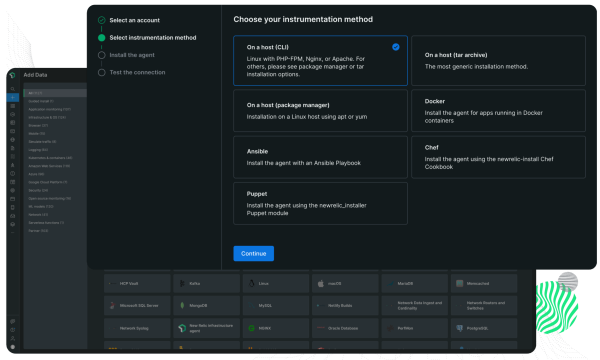
Django observability quickstart contains 1 documentation reference. This is how you'll get your data into New Relic.

What is Django?

Django is a Python-based free, open-source web framework that follows the model-template-views architectural pattern. The framework enables the rapid development of secure and maintainable websites. It takes away the hassle of web development from developers, and empowers them to focus on writing apps without reinventing the wheel.

New Relic Django quickstart features

The New Relic Django monitoring quickstart has the following features:

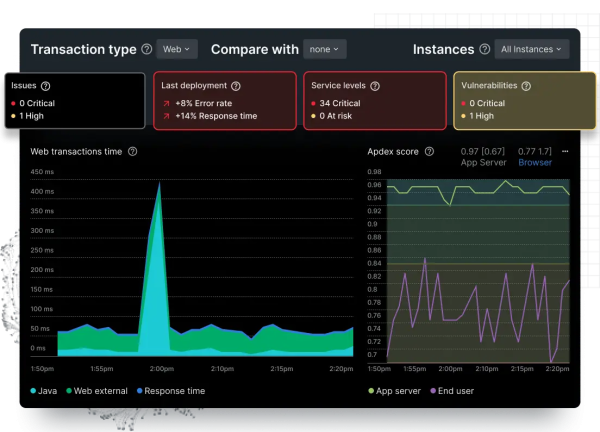
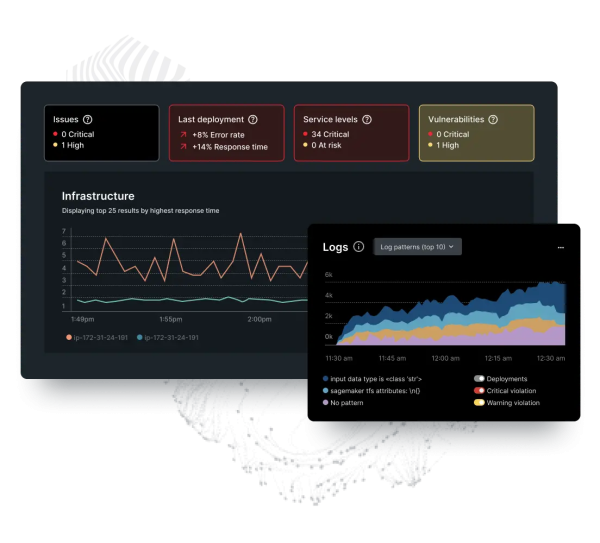
  • Dashboard: Our standard dashboard provides a clear overview of transactions and errors. The dashboards also help you track other key indicators like daily transaction errors, comparison between weekly transaction errors, memory heap used, most popular transactions, and more.
  • Alerts: You can get instant alerts on performance metrics like Apdex score, CPU utilization, and transaction error.

Why monitor Django with New Relic?

Proactively monitor Django with New Relic’s Python agent. With an interactive dashboard, you can explore, query, and visualize your data. The quickstart also has three alerts that can detect changes in key metrics:

  • The transaction error alert is triggered when transactions fail more than 10% of the time during a 5-minute period.
  • The high CPU utilization alert is triggered when the CPU utilization is above 90%.
  • Similarly, the Apdex score alert is triggered when the Apdex score is below 0.5 during a period of 5 minutes.

In addition, the New Relic Django integration can automatically add browser monitoring to any HTML page responses for the Django Python web framework. Install the New Relic Django quickstart to instrument Django with New Relic’s Python agent, and track Django’s key metrics in real-time.

How to use this quickstart

  • Sign Up for a free New Relic account or Log In to your existing account.
  • Click the install button.
  • Install the quickstart to get started or improve how you monitor your environment. They're filled with pre-built resources like dashboards, instrumentation, and alerts.
Authors
New Relic
Support
BUILT BY NEW RELIC
Need help? Visit our Support Center or check out our community forum, the Explorers Hub.