Quickstart
Why monitor Curb?
Curb establishes Ruby-language bindings for the libcurl3. It is a fully-featured client-side URL transfer library. New Relic Curb quickstart automatically instruments Curb with the New Relic Ruby agent, thereby empowering you to monitor Curb via interactive dashboards and instant alerts.
Curb quickstart highlights
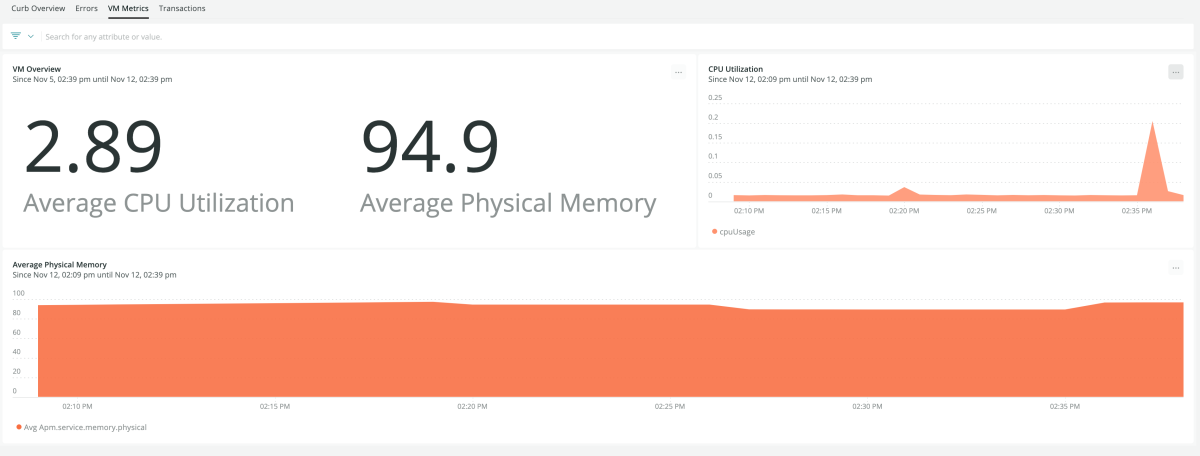
The New Relic Curb quickstart has the following features: Dashboards: Our dashboards provide you a clear overview of transactions, errors, and the virtual machine. The dashboards also help you monitor other key indicators like top 5 slowest transactions, latest errors, and more. Alerts: You can get instant alerts on performance metrics like Apdex score, memory usage, transaction errors, and CPU utilization.
New Relic + Curb = Optimum performance monitoring
Monitor Curb with New Relic’s Ruby agent. With an interactive dashboard, you can explore, query, and visualize your data. This helps you to identify issues faster and improve Curb’s performance. The quickstart also has four alerts that can detect changes in key metrics. You can integrate the alerts with your favorite tools such as Slack or PagerDuty, and you will get instant notification when there is any issue. You can configure the New Relic Ruby agent with settings in a configuration file, environment variables, or programmatically with server-side configuration. The Ruby agent supports Curb version 0.8.1 or higher. Install the New Relic Curb observability quickstart today to track Curb’s metrics in real time through a seamless dashboard and different alerts. The quickstart empowers you to leverage our Ruby agent for instant and comprehensive monitoring of Curb.
Need help? Visit our Support Center or check out our community forum, the Explorers Hub.

