Quickstart
What is Azure NetApp Capacity Pools?
Azure NetApp Capacity Pools are a way to organize and manage storage capacity in Azure NetApp Files. A capacity pool is a logical container for volumes that share the same performance characteristics and service level. You can create multiple capacity pools within a NetApp account. Azure NetApp Capacity Pool is measured by its provisioned capacity.
New Relic Azure NetApp Capacity Pools quickstart features
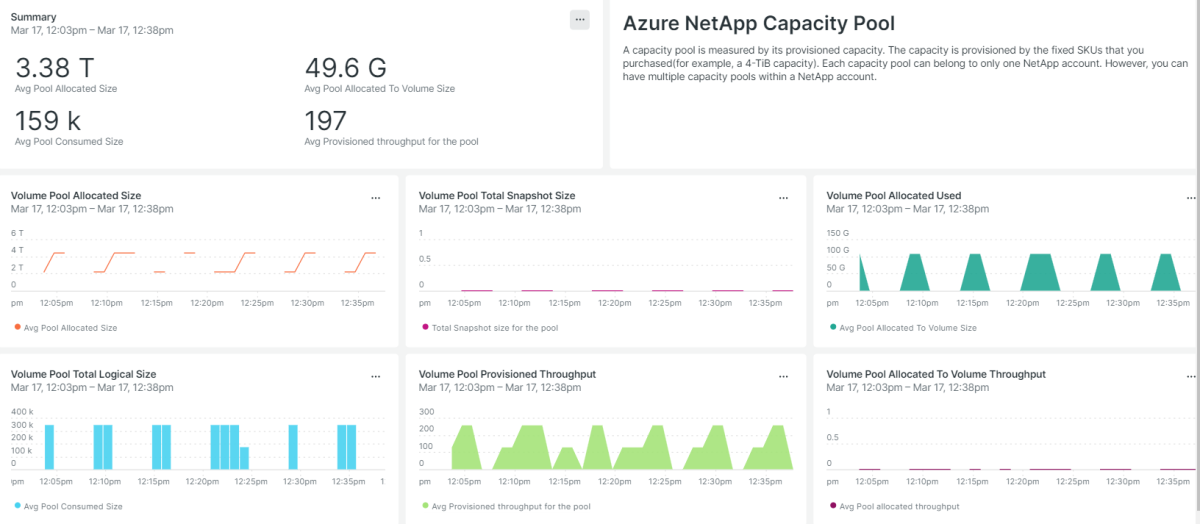
A standard dashboard that tracks key indicators like pool allocated size, pool allocated throughput, pool consumed size and Provisioned throughput for the pool. It runs custom queries and visualizes the data immediately.
Why monitor Azure NetApp Capacity Pools with New Relic?
New Relic Azure NetApp Capacity Pools monitoring quickstart empowers you to track the performance of Azure NetApp Capacity Pools via different metrics including pool allocated size, pool allocated throughput, pool consumed size and Provisioned throughput for the pool.
Our integration features a standard dashboard that provides interactive visualizations to explore your data, understand context, and get valuable insights.
Start ingesting your Azure data today and get immediate access to our visualization dashboards so you can optimize your Azure service.
Need help? Visit our Support Center or check out our community forum, the Explorers Hub.


