If you already have an application running in Kubernetes and are exploring using OpenTelemetry to gain insights into the health and performance of your app and cluster, you might be interested in an implementation of the Kubernetes Operator called the OpenTelemetry Operator.
As you’ll learn shortly, due to its range of capabilities, the Operator is your go-to for (almost) hassle-free OpenTelemetry management. But, as with any powerful tool, what happens when things go sideways?
In this blog post, you’ll learn about the OpenTelemetry Operator (hereafter referred to as “the Operator”), along with issues commonly encountered across installation, Collector deployment, and auto-instrumentation. You’ll also learn how to resolve these issues, and be better prepared for running the Operator.
Overview of the Operator
Let’s take a closer look at the Operator’s main capabilities.
Managing the OTel Collector
The Operator automates the deployment of your Collector, and makes sure it's correctly configured and running smoothly within your cluster. The Operator also manages configurations across a fleet of Collectors using Open Agent Management Protocol (OpAMP), which is a network protocol for remotely managing large fleets of data collection agents. Since the protocol is vendor-agnostic, this helps ensure consistent observability settings and simplifies management across agents from different vendors.
Managing auto-instrumentation in pods
The Operator automatically injects and configures auto-instrumentation for your applications, which enables you to collect telemetry data without modifying your source code. If your application isn’t already instrumented with OpenTelemetry, this is a fantastic option to feed two birds with one scone, and start generating and collecting application telemetry.
Installing the Operator
This might seem obvious, but before installing the Operator, you must have a Kubernetes cluster you can install it into, running Kubernetes 1.23+. Check the compatibility matrix for specific version requirements. You can spin up a cluster on your machine using a local Kubernetes tool such as minikube, k0s, or KinD, or use a cluster running on a cloud provider service.
Next, and this is less obvious: You must have a component called cert-manager already installed in that cluster. This piece manages certificates for Kubernetes by making sure the certificates are valid and up to date. You can install both the cert-manager and the Operator via kubectl or a Helm chart.
TIP: Note that in either case, you have to wait for cert-manager to finish installing before you install the Operator; otherwise, the operator installation will fail.
Using kubectl
To install cert-manager, run the following command:
kubectl apply -f https://github.com/cert-manager/cert-manager/releases/download/v1.10.0/cert-manager.yamlNext, install the Operator:
kubectl apply -f https://github.com/open-telemetry/opentelemetry-operator/releases/latest/download/opentelemetry-operator.yamlUsing Helm
To install cert-manager, first add the Helm repository:
helm repo add jetstack https://charts.jetstack.io --force-updateNext, install the cert-manager Helm chart:
helm install \
  cert-manager jetstack/cert-manager \
  --namespace cert-manager \
  --create-namespace \
  --version v1.16.1 \
  --set crds.enabled=true
Expect the preceding step to take up to a few minutes. You can verify your installation of cert-manager by following the steps in this link, or check the deployment status by running:
kubectl get pods –namespace cert-managerTo install the Operator, note that Helm 3.9+ is required. First, add the repo:
helm repo add open-telemetry https://open-telemetry.github.io/opentelemetry-helm-charts
helm repo update
Then, install the Operator:
helm install  --namespace opentelemetry-operator-system \
  --create namespace \
  opentelemetry-operator open-telemetry/opentelemetry-operator
Deploying the OpenTelemetry Collector
Once you have cert-manager and Operator set up in your cluster, you can deploy the Collector. The Collector is a versatile component that’s able to ingest telemetry from a variety of sources, transform the received telemetry in a number of ways based on its configuration, and then export that processed data to any backend that accepts the OpenTelemetry data format (also referred to as OTLP, which stands for OpenTelemetry Protocol).
The Collector can be deployed in several different ways, referred to as “patterns.” Which pattern or patterns you deploy is dependent on your telemetry needs and organizational resources. This topic is out of scope for this blog post, but you can read more about them via this link.
Collector custom resource
A custom resource (CR) represents a customization of a specific Kubernetes installation that isn’t necessarily available in a default Kubernetes installation; CRs help make Kubernetes more modular.
The Operator has a CR for managing the deployment of the Collector, called OpenTelemetryCollector. The following is a sample OpenTelemetryCollector resource:
apiVersion: opentelemetry.io/v1beta1
kind: OpenTelemetryCollector
metadata:
  name: otelcol
  namespace: opentelemetry
spec:
  mode: statefulset
  config:
    receivers:
      otlp:
        protocols:
          grpc: {}
          http: {}
      prometheus:
        config:
          scrape_configs:
            - job_name: 'otel-collector'
              scrape_interval: 10s
              static_configs:
              - targets: [ '0.0.0.0:8888' ]

    processors:
      batch: {}

    exporters:
      logging:
        verbosity: detailed

    service:
      pipelines:
        traces:
          receivers: [otlp]
          processors: [batch]
          exporters: [logging]
        metrics:
          receivers: [otlp, prometheus]
          processors: []
          exporters: [logging]
        logs:
          receivers: [otlp]
          processors: [batch]
          exporters: [logging]
There are many configuration options for the OpenTelemetryCollector resource, depending on how you plan on instantiating it; however, the basic configuration requires:
mode, which should be one of the following:deployment,sidecar,daemonset, orstatefulset. If you leave outmode, it defaults todeployment.config, which may look familiar, because it’s the Collector’s YAML config.
Common Collector deployment issues and troubleshooting tips
If you’re not seeing the data you expect, or you suspect something isn’t working right, try the following troubleshooting tips.
Check that the Collector resources deployed properly
When an OpenTelemetryCollector YAML is deployed, the following objects are created in Kubernetes:
- OpenTelemetryCollector
- Collector pod:
- If you specified non-sidecar
mode, look forDeployment,StatefulSet, orDaemonSetresources named<collector_CR_name>-collector-<unique_identifier>). - If you specified the
modeassidecar, a Collector sidecar container will be created in an app pod, namedotc-container.
- If you specified non-sidecar
- Target Allocator pod:
- If you enabled the Target Allocator, look for a resource named
<collector_CR_name>-targetallocator-<unique_identifier>.
- If you enabled the Target Allocator, look for a resource named
ConfigMapof Collector configurations:- If you specified non-sidecar mode, look for
Deployment,StatefulSet, orDaemonSetresources named<collector_CR_name>-collector-<unique_identifier>. - If you specified the mode as
sidecar, note that the Collector config is included as an environment variable.
- If you specified non-sidecar mode, look for
Thus, when you deploy the OpenTelemetryCollector resource, make sure that the preceding objects are created.
First, confirm that the OpenTelemetryCollector resource was deployed:
kubectl get otelcol -n <namespace>When you deploy the Collector using the OpenTelemetryCollector resource, it creates a ConfigMap containing the Collector’s configuration YAML. Confirm that the ConfigMap was created in the same namespace as the Collector, and that the configurations themselves are correct.
List your ConfigMaps:
kubectl get configmap -n <namespace> | grep <collector-cr-name>-collectorWe also recommend checking your Collector pods by running the appropriate command based on the Collector’s mode:
deployment,statefulset,daemonsetmodes:
kubectl get pods -n <namespace> | grep <collector_cr_name>-collectorsidecarmode:
kubectl get pods <pod_name> -n opentelemetry -o jsonpath='{.spec.containers[*].name}'This will list all the containers that were created in the pod, including the Collector sidecar container. The Collector config is included as an environment variable in the Collector sidecar container.
Check the Collector CR version
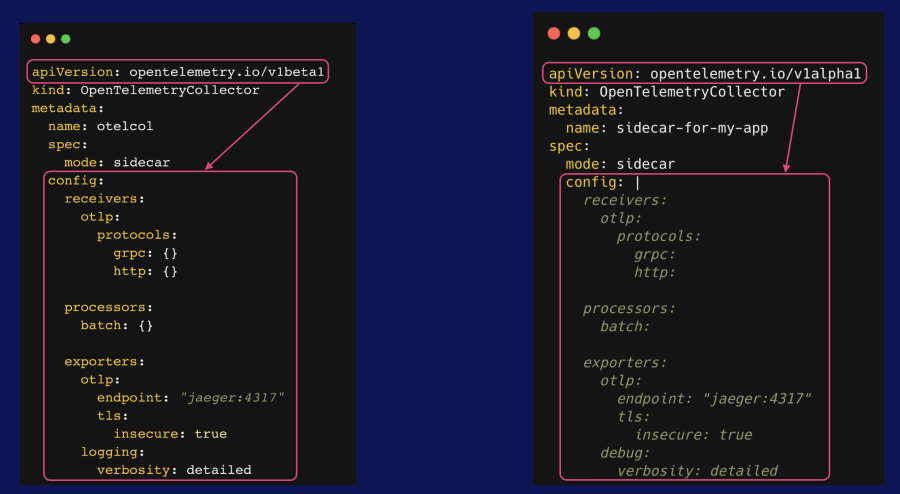
Take a look at the OpenTelemetryCollector CR version you’re using. There are two versions available: v1alpha1 and v1beta1.

There are two main differences between these two API versions:
- The
configsections are different; forv1beta1, the config values are key-value pairs that are part of the CR configuration, whereas forv1alpha1, the config value is one long text string. Keep in mind that the text string still needs to follow YAML formatting. - If you’re using
v1beta1, you can’t leave the Collector config values empty. You must specify either empty curly braces ({}) for scalar values or empty brackets ([ ]) for arrays. This isn’t necessary if you’re usingv1alpha1.
Check the Collector base image
By default, the OpenTelemetryCollector CR uses the core distribution of the Collector. The core distribution is a bare-bones distribution of the Collector for OpenTelemetry developers to develop and test. It contains a base set of components: extensions, connectors, receivers, processors, and exporters.
If you want access to more components than the ones offered by core, you can use the Collector’s Kubernetes distribution instead. This distribution is made specifically to be used in a Kubernetes cluster to monitor Kubernetes and services running in Kubernetes. It contains a subset of components from the core and contrib distributions. Alternatively, you can build your own Collector distribution.
You can set the Collector’s base image by specifying the image attribute in spec.image, as in the following example:
apiVersion: opentelemetry.io/v1beta1
kind: OpenTelemetryCollector
metadata:
  name: otelcol
  namespace: opentelemetry
spec:
  mode: statefulset
  image: otel/opentelemetry-collector/contrib:0.102.1
config:
  receivers:
    otlp:
      protocols:
       grpc: {}
       http: {}
  processors:
    batch: {}
  exporters:
    otlp:
      endpoint: https://otlp.nr-data.net:4318
Check your license key
Confirm that you've configured the appropriate New Relic account license key, which is required to send telemetry to your New Relic account. To prevent it from appearing as plain text, you can export it as an environment variable, or create a Kubernetes secret to store it. You can optionally use a secrets provider or your own cloud provider’s secrets provider.
Check your New Relic endpoint configuration
Confirm that you've configured the correct OTLP endpoint for your region in your exporter configuration.
Instrumentation
Instrumentation is the process of adding code to software to generate telemetry signals–logs, metrics, and traces. You have several options for instrumenting your code with OpenTelemetry, the primary two being code-based and zero-code solutions.
Code-based solutions require you to manually instrument your code using the OpenTelemetry API. While it can take time and effort to implement, this option enables you to gain deep insights and further enhance your telemetry, as you have a high degree of control over what parts of your code are instrumented and how.
To instrument your code without modifying it (or if you’re unable to modify the source code), you can use zero-code solutions (or auto-instrumentation agents). This method uses shims or bytecode agents to intercept your code at runtime or at compile-time to add tracing and metrics instrumentation to the third-party libraries and frameworks you depend on. At the time of publication, auto-instrumentation is currently available for Java, Python, .NET, JavaScript, PHP, and Go. Learn more about zero-code instrumentation at this link.
You can also use both options simultaneously–some end users opt to get started with a zero-code agent, then manually insert additional instrumentation, such as adding custom attributes or creating new spans. Alternatively, OpenTelemetry also provides options beyond code-based and zero-code solutions. Learn more at this link.
Zero-code instrumentation with the Operator
The Operator has a CR called Instrumentation that can automatically inject and configure OpenTelemetry instrumentation into your Kubernetes pods, providing the benefit of zero-code instrumentation for your application. This is currently available for the following: Apache HTTPD, .NET, Go, Java, nginx, Node.js, and Python.
The following is a sample Instrumentation resource definition for a Python service:
apiVersion: opentelemetry.io/v1alpha1
kind: Instrumentation
metadata:
  name: python-instrumentation
  namespace: application
spec:
  env:
    - name: OTEL_EXPORTER_OTLP_TIMEOUT
      value: "20"
    - name: OTEL_TRACES_SAMPLER
      value: parentbased_traceidratio
    - name: OTEL_TRACES_SAMPLER_ARG
      value: "0.85"
  exporter:
    endpoint: http://localhost:4317
  propagators:
    - tracecontext
    - baggage
  sampler:
    type: parentbased_traceidratio
    value: "0.25"
  python:
    env:
      - name: OTEL_METRICS_EXPORTER
        value: otlp_proto_http
      - name: OTEL_LOGS_EXPORTER
        value: otlp_proto_http
      - name: OTEL_PYTHON_LOGGING_AUTO_INSTRUMENTATION_ENABLED
        value: "true"
      - name: OTEL_EXPORTER_OTLP_ENDPOINT
        value: http://localhost: 4318
You can use a single auto-instrumentation YAML to serve multiple services written in different languages (provided they are supported for auto-instrumentation). List your global environment variables under spec.env, and list language-specific environment variables under spec.<language_name>.env. You can mix and match language-specific environment variable configurations in the same Instrumentation resource.
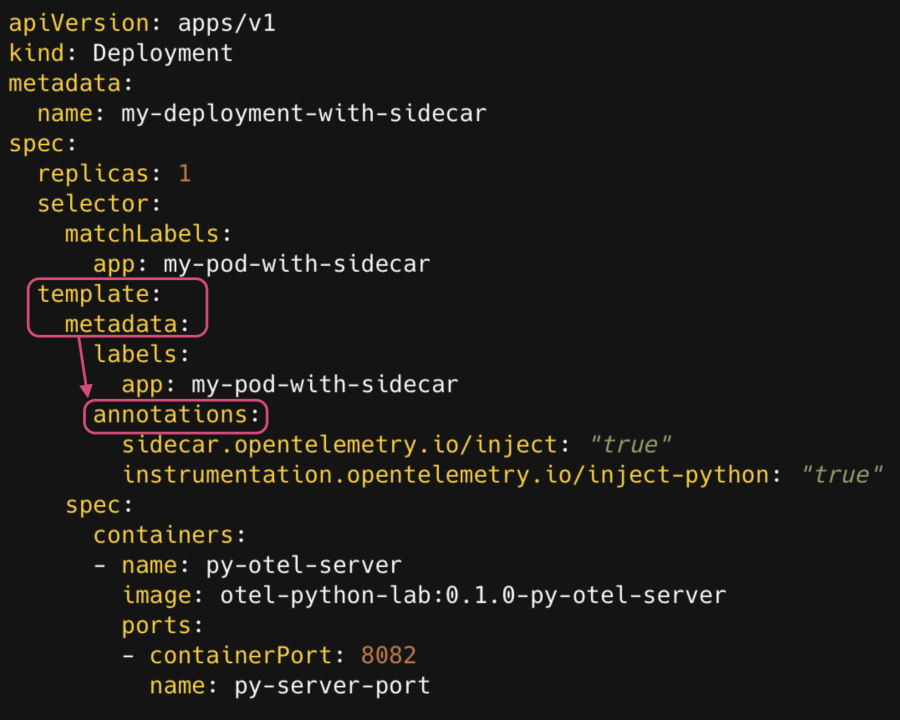
In order to use the Operator’s auto-instrumentation capability, deploying an Instrumentation resource alone isn’t enough. The auto-instrumentation configuration must be associated with the code being instrumented. This is done by adding an auto-instrumentation annotation in your application’s Deployment YAML, in the template definition section, such as in the following example:
apiVersion: apps/v1
kind: Deployment
metadata:
  name: my-deployment-with-sidecar
spec:
  replicas: 1
  selector:
    matchLabels:
      app: my-pod-with-sidecar
  template:
    metadata:
      labels:
        app: my-pod-with-sidecar
      annotations:
        sidecar.opentelemetry.io/inject: "true"
        instrumentation.opentelemetry.io/inject-python: "true"
spec:
  containers:
    - name: py-otel-server
      image: otel-python-lab:0.1.0-py-otel-server ports:
    - containerPort: 8082
      name: py-server-port
When the annotation called instrumentation.opentelemetry.io/inject-python is set to true, it tells the Operator to inject Python auto-instrumentation (in this case) into the containers running in this pod. For other languages, simply replace python with the appropriate language name (for example, instrumentation.opentelemetry.io/inject-java for Java apps). You can disable instrumentation by setting this value to false.
If you have multiple Instrumentation resources, you need to specify which one to use, otherwise the Operator won’t know which one to pick. You can do this as follows:
- By name. Use this if the
Instrumentationresource resides in the same namespaces as theDeployment. For example,instrumentation.opentelemetry.io/inject-java: my-instrumentationwill look for anInstrumentationresource calledmy-instrumentation. - By namespace and name. Use this if the
Instrumentationresource resides in a different namespace. For example:instrumentation.opentelemetry.io/inject-java: my-namespace/my-instrumentationwill look for anInstrumentationresource calledmy-instrumentationin the namespacemy-namespace.
You must deploy the Instrumentation resource before the annotated application; otherwise, your code won’t be automatically instrumented. The Operator injects auto-instrumentation by adding an init container to the application’s pod when it starts up, which means that if the Instrumentation resource isn’t available by the time your service is deployed, the auto-instrumentation will fail.
Common instrumentation issues and troubleshooting tips
If your Collector doesn’t seem to be processing data or if you think the auto-instrumentation isn’t working, try the following steps to troubleshoot and resolve the problem.
Check that the instrumentation resource deployed properly
Run the following command to make sure the Instrumentation resource(s) was created in your Kubernetes cluster:
kubectl describe otelinst -n <namespace>Check the Operator logs
Run the following command to check the Operator logs for any error messages:
kubectl logs -l app.kubernetes.io/name=opentelemetry-operator \
  --container manager \
  -n opentelemetry-operator-system --follow
Confirm the resource deployment order
Double check that your Instrumentation CR is deployed before your Deployment.
Check your auto-instrumentation CR annotations
- Confirm that there are no typos in the annotations.
- Confirm that they are in the pod’s metadata definition (
spec.template.metadata.annotation), not the deployment’s metadata definition (metadata.annotation), as in the following example:

Check your endpoint configurations
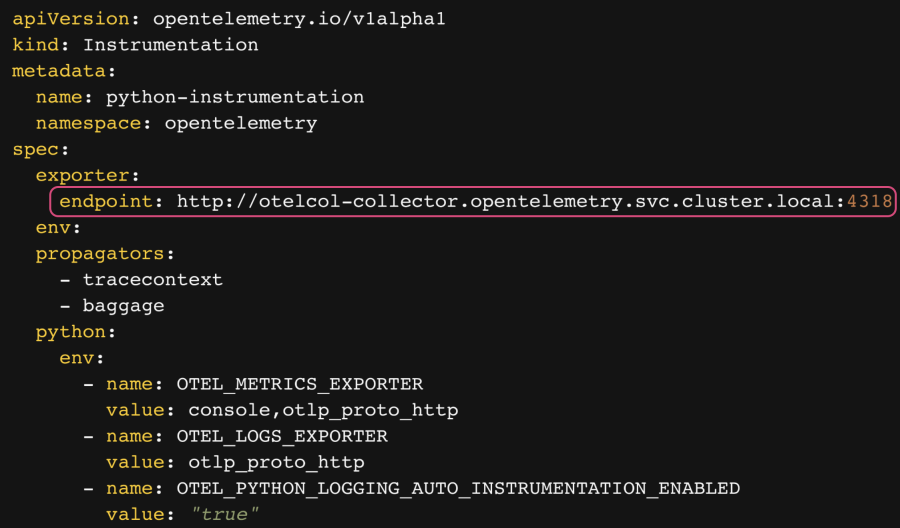
The endpoint, configured in the following example under spec.exporter.endpoint, refers to the destination for your telemetry within your Kubernetes cluster:

If you’re exporting your telemetry to a non-sidecar Collector in your Kubernetes cluster, this value must reference the name of your Collector service. In the preceding example, otel-collector is the name of the Collector Kubernetes Service.
In addition, if your Collector is running in a different namespace, you must append it to the Collector’s service name, for example: <namespace>.svc.cluster.local (in the preceding example, the namespace is opentelemetry).
If you’re exporting your telemetry to a sidecar Collector, your exporter.endpoint value would be http://localhost:4317 (gRPC) or http://localhost:4318 (HTTP).
Finally, make sure that you’re using the correct Collector port. Normally, you can choose either 4317 (gRPC) or 4318 (HTTP); however, for Python auto-instrumentation, you can only use 4318, since gRPC is not supported. Confirm whether there are similar caveats for the language(s) you’re using.
Summary
The OpenTelemetry Operator manages the deployment and configuration of one or more Collectors, and injects and configures zero-code instrumentation solutions into your Kubernetes pods. This enables you to get started with OpenTelemetry instrumentation, and you can further enhance your telemetry by adding manual instrumentation to your application.
In this blog post, you learned the ins and outs of the Operator, from common installation hurdles to resolving auto-instrumentation and Collector deployment issues. With detailed installation steps and troubleshooting tips, you’re now equipped to leverage the Operator effectively for the deployment, configuration, and management of your Collectors and auto-instrumentation of supported libraries.
Próximos pasos
Now that you know how to install the Operator and take advantage of its capabilities, try it yourself! Deploy the New Relic fork of the OpenTelemetry Community demo application, the Astro Shop, and try installing the Operator. Alternatively, clone this repo.
We also recommend checking out the following resources:
- Learn more about the Collector: Demystifying the OpenTelemetry Collector: The key fundamentals.
- Learn how to deploy the New Relic fork of Astro Shop using Helm: Running the OpenTelemetry community demo app in New Relic.
- Learn more about the OpenTelemetry Operator: Collection of Adriana’s OpenTelemetry Operator Articles.
- Learn more about troubleshooting the Operator in the official OTel Documentation.
Las opiniones expresadas en este blog son las del autor y no reflejan necesariamente las opiniones de New Relic. Todas las soluciones ofrecidas por el autor son específicas del entorno y no forman parte de las soluciones comerciales o el soporte ofrecido por New Relic. Únase a nosotros exclusivamente en Explorers Hub ( discus.newrelic.com ) para preguntas y asistencia relacionada con esta publicación de blog. Este blog puede contener enlaces a contenido de sitios de terceros. Al proporcionar dichos enlaces, New Relic no adopta, garantiza, aprueba ni respalda la información, las vistas o los productos disponibles en dichos sitios.


