Quickstart
What is Azure Translator?
Azure Translator is a cloud-based machine translation service you can use to translate text and documents with a simple REST API call.
New Relic Azure Translator quickstart features
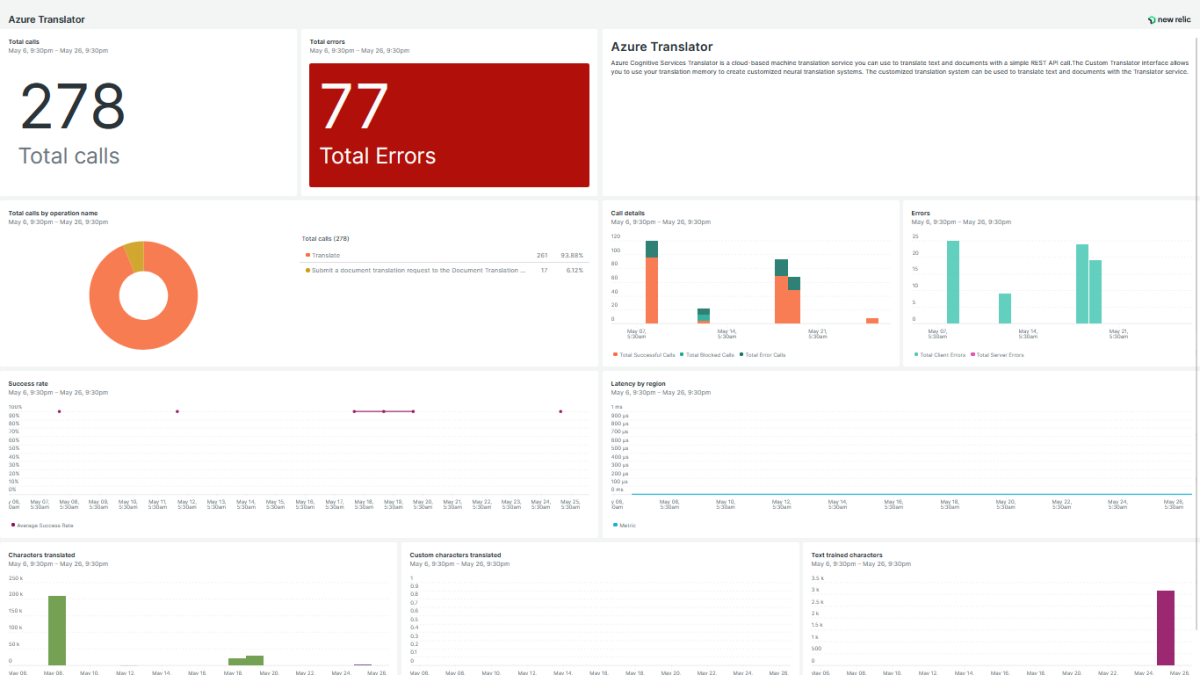
A standard dashboard that tracks key indicators like total calls, total errors, Text trained characters, Successful calls and sucess rate. It runs custom queries and visualizes the data immediately.
Why monitor Azure Translator with New Relic?
New Relic Azure Translator monitoring quickstart empowers you to track the performance of Azure Translator via different metrics including total calls, total errors, Text trained characters, Successful calls and sucess rate.
Our integration features a standard dashboard that provides interactive visualizations to explore your data, understand context, and get valuable insights.
Start ingesting your Azure data today and get immediate access to our visualization dashboards so you can optimize your Azure service.
Need help? Visit our Support Center or check out our community forum, the Explorers Hub.


