New Relic Now Start training on Intelligent Observability February 25th.
Save your seat.
현재 이 페이지는 영어로만 제공됩니다.
 / 
Azure Network Interface

Azure Network Interface

Monitoring Azure Network Interface is critical to track the performance of the networks via key metrics. Download New Relic Azure Network Interface monitoring quickstart to get a pre-built dashboard tailored to monitor your Azure Network Interface service.

What's included?

dashboards
1
Azure Network Interface quickstart contains 1 dashboard. These interactive visualizations let you easily explore your data, understand context, and resolve problems faster.
documentation
1
Azure Network Interface observability quickstart contains 1 documentation reference. This is how you'll get your data into New Relic.
alerts
0
This quickstart doesn't include any alerts. Do you think it should?
You can edit this quickstart to add helpful components. View the repository and open a pull request.
View repo View repo

What is Azure Network Interface?

A network interface enables an Azure VM to communicate with internet, Azure and on-premises resources. A VM has one or more network interfaces.

New Relic Azure Network Interface quickstart features

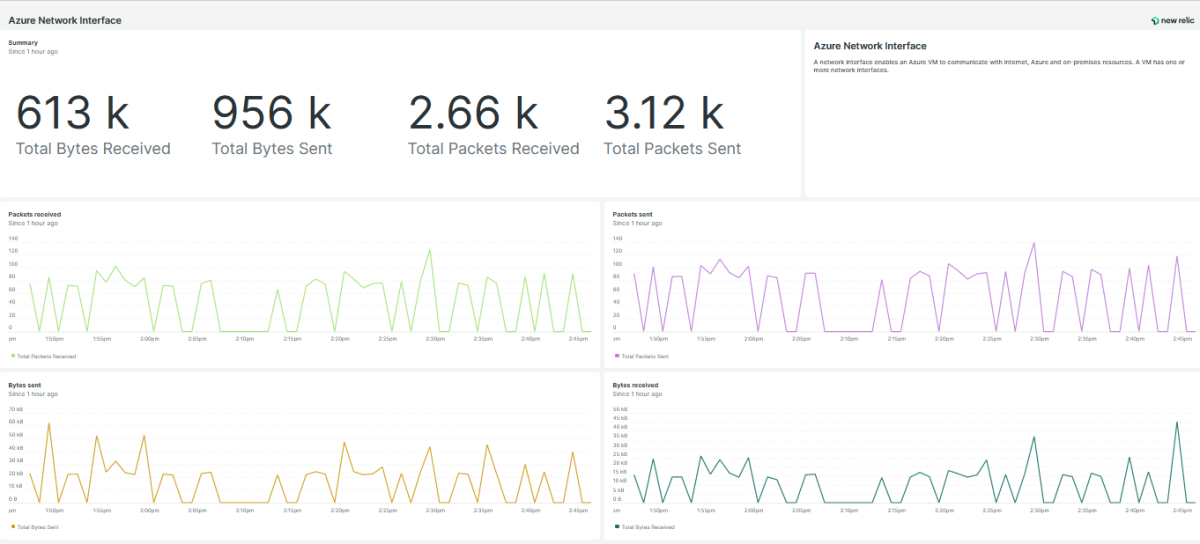
A standard dashboard solely focused on Azure Network Interface and tracks key indicators like bytes received rate, bytes sent rate, packet received rate and more. It runs custom queries and visualizes the data immediately.

Why monitor Azure Network Interface with New Relic?

New Relic Azure Network Interface monitoring quickstart empowers you to track the performance of Azure Network Interface via different metrics including bytes received rate, bytes sent rate, packet received rate and more.

Our integration features a standard dashboard that provides interactive visualizations to explore your data, understand context and get valuable insights.

Start ingesting your Azure data today and get immediate access to our visualization dashboards so you can optimize your Azure service.

How to use this quickstart

  • Sign Up for a free New Relic account or Log In to your existing account.
  • Click the install button.
  • Install the quickstart to get started or improve how you monitor your environment. They're filled with pre-built resources like dashboards, instrumentation, and alerts.