Previously, we covered how to deploy the OpenTelemetry community demo application in Kubernetes, and how to utilize the New Relic platform to troubleshoot issues with your OpenTelemetry Protocol (OTLP) data using features such as workloads and errors inbox. For a refresher on OpenTelemetry and to learn more about the background of the demo application, check out: Hands-on OpenTelemetry: Troubleshoot issues with your instrumented apps.
In this blog post, we’ll cover the changes we’ve made to our fork of the demo app since then; feature flag demo scenarios, how to enable one, and how to navigate that data in New Relic; how to use our Helm chart to monitor your Kubernetes cluster with the OpenTelemetry Collector; and finally, what’s in the works for the fork.
Additions to the New Relic fork of the demo app
New Relic has made the following modifications to our fork of the demo app:
- The .env file contains environment variables specific to New Relic so you can quickly ship the data to your account.
- Helm users can enable a version of recommendationservice that has been instrumented with the New Relic agent for Python APM instead of OpenTelemetry.
- We’ve included a tutorial section that covers how to navigate some of the “feature flags” included in the demo (more on feature flags in the following section of this post).
Feature flag demo scenarios
The Community Demo App Special Interest Group, which is the team that develops and maintains the demo app, has added a number of demo scenarios that you can enable via feature flags to simulate various situations. These scenarios include errors on specific calls, memory leaks, and high CPU load. A feature flag service called flagd manages the flags, and enabling a flag is as simple as updating a value in a config file, as you’ll see shortly.
In this section, we’ll cover how you can deploy the app locally using a Helm chart, view the web store and load generator UIs, enable one of the demo scenario feature flags, and navigate the data in New Relic.
Now you’re ready to deploy the New Relic fork of the OpenTelemetry Astronomy Shop Demo application in your own environment. Follow along with the instructions below to get started.
In order to spin up the demo app locally, you’ll need the following requirements:
- A Kubernetes 1.23+ cluster (either a pre-existing cluster, or you can spin up a new one using minikube)
- Helm 3.9+ (see the Helm installation instructions)
- kubectl installed (test by running kubectl –help)
- A New Relic account (sign up here if you need one—it’s free, forever!)
Step 1: Deploy the app using Helm
- First, clone a copy of the fork to your local machine, then navigate into the top directory:
git clone git@github.com:newrelic/opentelemetry-demo.git
cd opentelemetry-demo
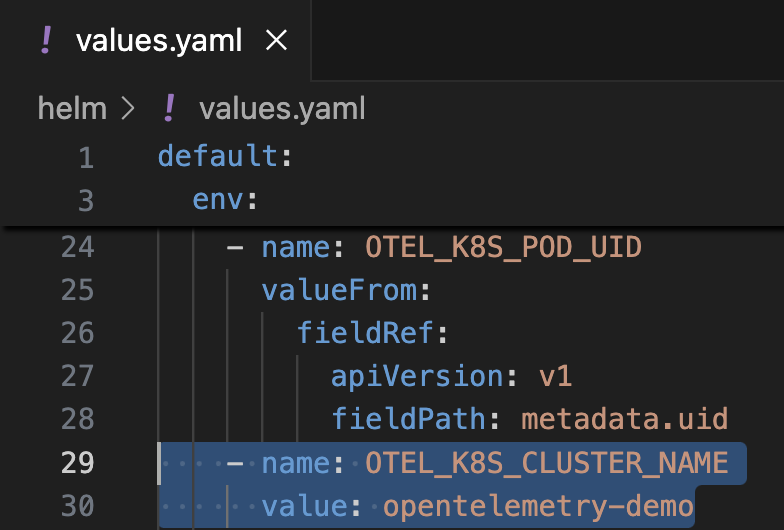
NOTE: If you’re deploying the app to an existing cluster, navigate to the “helm” directory and open the values.yaml file to update the name of the cluster (see the following image). Otherwise, continue on to the next step:
2. Next, add the OpenTelemetry Helm chart:
helm repo add open-telemetry https://open-telemetry.github.io/opentelemetry-helm-charts && helm repo update open-telemetry3. Obtain your New Relic license key (look for the key type “INGEST – LICENSE”) from your account, and export it as an environment variable (make sure you replace “<NEW_RELIC_LICENSE_KEY>” with your actual license key):
export NEW_RELIC_LICENSE_KEY=<NEW_RELIC_LICENSE_KEY>4. In this step, you’ll create the namespace “otel-demo” and set a Kubernetes secret that contains your New Relic license key for that namespace:
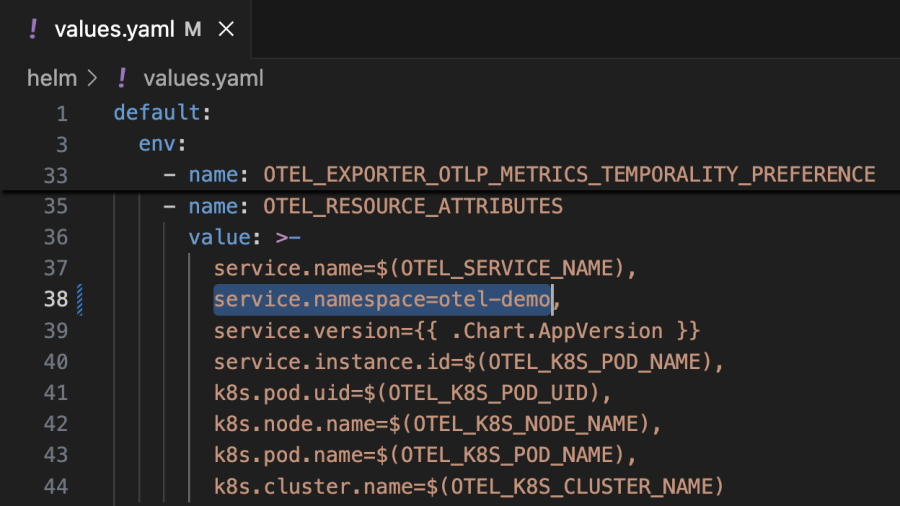
kubectl create ns otel-demo && kubectl create secret generic newrelic-license-key --from-literal=license-key="$NEW_RELIC_LICENSE_KEY" -n otel-demoWe recommend that you use the namespace “otel-demo” to prevent running into issues when you enable a feature flag in the upcoming section, as that’s hardcoded into the values.yaml file. If you want to use a different namespace, you’ll have to update all the instances in the values.yaml file as well. The following screenshot shows where it has been configured as an OpenTelemetry resource attribute:
5. Finally, you’ll install the Helm chart with the release name “newrelic-otel” and pass in the provided values.yaml (changing the release name when you make a config change allows you to see which instances are running on that release):
- For US-based accounts:
helm upgrade --install newrelic-otel open-telemetry/opentelemetry-demo --version 0.32.0 --values ./helm/values.yaml -n otel-demo- For EU-based accounts:
helm upgrade --install newrelic-otel open-telemetry/opentelemetry-demo --version 0.32.0 --values ./helm/values.yaml --set opentelemetry-collector.config.exporters.otlp.endpoint="otlp.eu01.nr-data.net:4318" -n otel-demoStep 2: View the frontend and load generator UIs
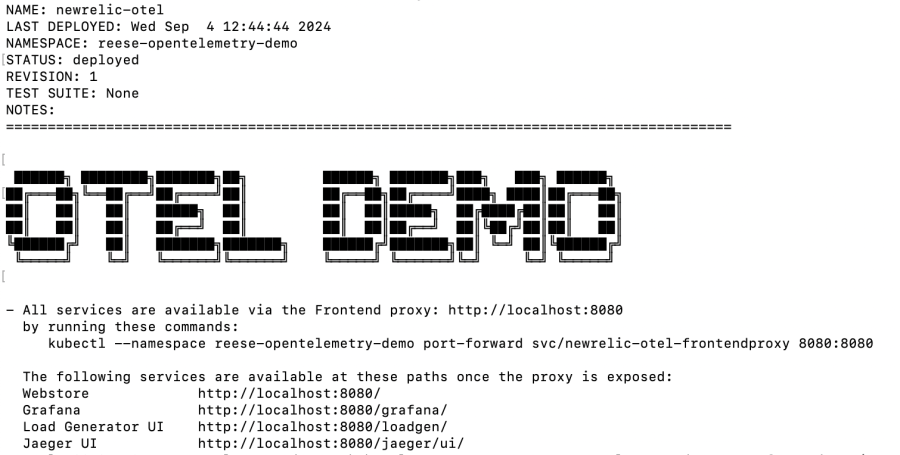
- Once your application is deployed, you should see the following in your terminal. In a new Terminal/CLI window copy and run the displayed “kubectl” command to forward the Webstore (frontend) and Load Generator UI services to the Frontend proxy (note that additional configuration is needed to set up Grafana and Jaeger; those specific URLs will not work otherwise):
2. If you encounter an error, verify that the pods are running before forwarding the port again:
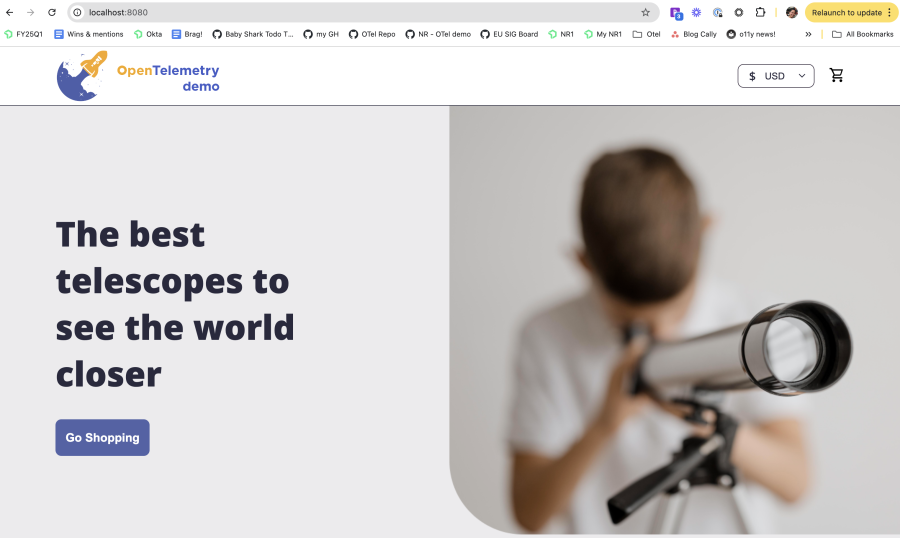
kubectl get pods -n otel-demo3. After a couple of minutes, you should be able to access the frontend of the demo app via the URL displayed in the preceding screen shot. You can click around the site like a typical ecommerce site, although the demo app comes with a load generator that simulates user traffic.
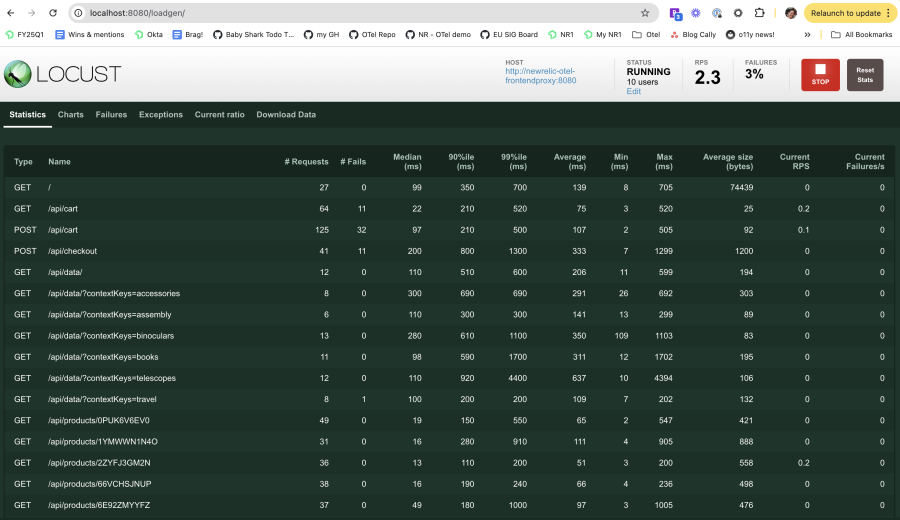
4. The load generator is based on Locust, a Python load-testing framework, and simulates user requests from the frontend. Accessing the Load Generator UI allows you to view data about the simulated traffic, including failed requests and average duration:
Step 3: View the demo app data in New Relic
Navigate to your New Relic account, click on All Entities in the left-hand menu, then select View all:
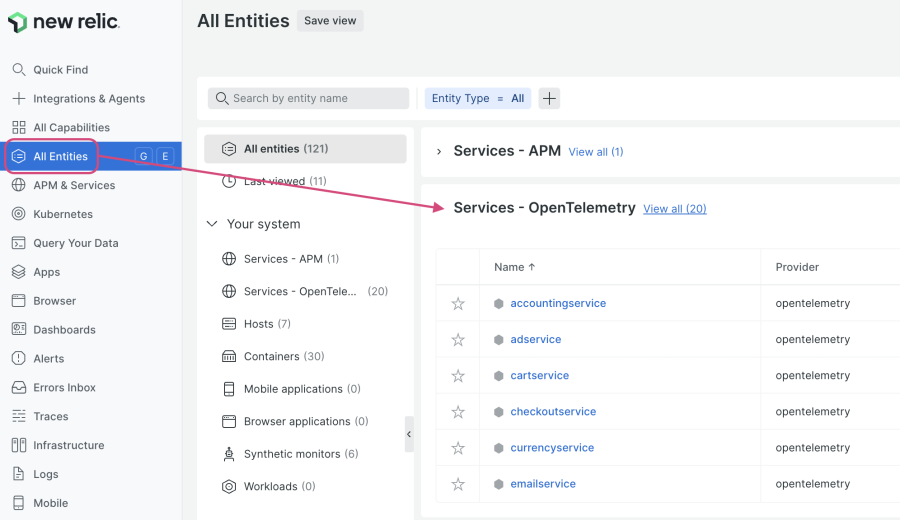
The view that opens up will show you a list of all your OpenTelemetry-instrumented services, including their response time, throughput, and error rate metrics. As you scroll through the list, you’ll see that the error rates are generally close to 0%. When you enable a feature flag, you’ll see a change in the error rate metrics for any impacted services, which we’ll explore further in the next section.
Note that in the “Entities” view, it’s expected that the response time, throughput, and error rate metrics won’t populate for the following services: loadgenerator, frontend-web, and kafka. This is because the query that generates this data is tracking the average response time of specific spans labeled as “server” or “consumer” for a particular service or entity, but these specific services don’t produce spans that fit the query parameters. Clicking into the services allows you to see that telemetry is indeed being collected, and not that data isn’t being reported.
Step 4: Enable a demo scenario feature flag
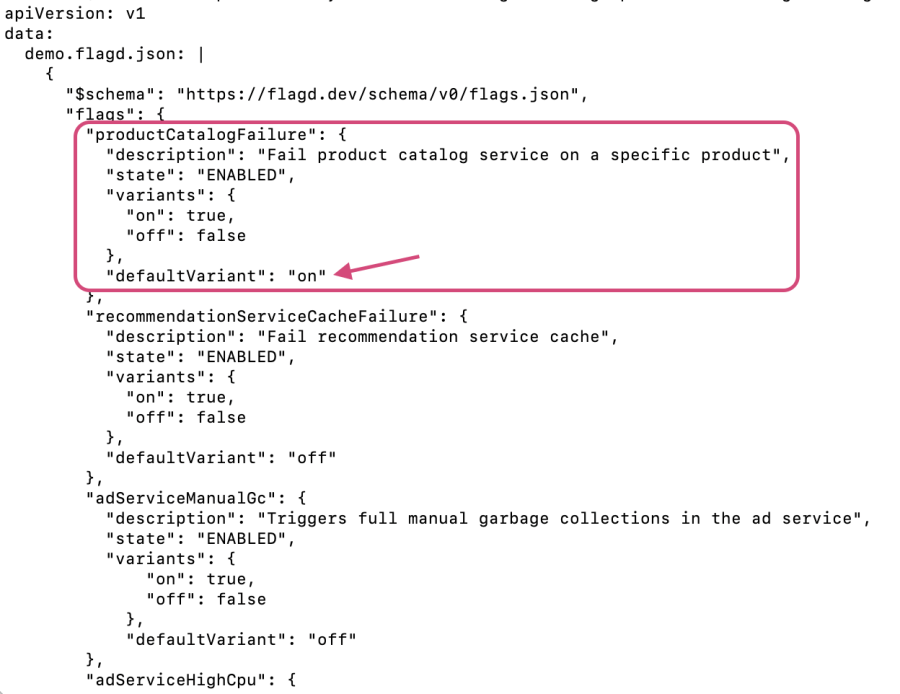
Enabling a feature flag to simulate one of the included scenarios is simple. Edit the “defaultVariant” value in the “src/flagd/demo.flagd.json” file to “on”. For this step, we’ll edit the file directly in our terminal using vi.
In this section, you’re going to enable the productCatalogFailure feature flag, which generates an error for “GetProduct” requests with the product ID “OLJCESPC7Z”.
- First, view the configmap for your flagd service:
kubectl get configmap newrelic-otel-flagd-config -n otel-demo -o yaml- If you used a release name other than “newrelic-otel”, replace it with the release name you used:
kubectl get configmap <release-name>-flagd-config -n otel-demo -o yaml- If you encounter an issue, it could be that the configmap name is incorrect. You can find the correct name of the configmap for flagd with the following command; look for a returned result with “-flagd-config” appended to the end:
kubectl get configmaps -n otel-demo --no-headers -o custom-columns=":metadata.name"2. Once you’re able to view the configmap for flagd, let’s edit it:
kubectl edit configmap <release-name>-flagd-config -n otel-demo3. When the file opens in your terminal, use vi to edit the file. First, type the letter i, which will enable “Insert” mode and allow you to modify the file. Use your arrow keys to navigate inside the file. When you reach the correct line as shown in the following screenshot, replace off with on, then save and exit the file by pressing the esc key to exit “Insert” mode, typing :wq, and then pressing enter to save and exit the file:
4. Restart the flagd service to apply the change:
kubectl rollout restart deployment newrelic-otel-flagd -n otel-demoTo check on your pods, use kubectl get pods -n otel-demo. You can also verify that the config change was picked up with kubectl get configmap newrelic-otel-flagd-config -n otel-demo -o yaml.
If you run into issues, here are a few basic troubleshooting steps you can take:
- View the logs for a given pod:
kubectl logs <pod-name> -c flagd -n otel-demo - Open a debug container on the problematic pod to explore its filesystem:
kubectl debug -it <pod-name> -n otel-demo --image=busybox --target=flagd -- /bin/sh- Note that if you don’t see the directory you’re looking for, the directory or the config file might not be correctly mounted or created within the pod.
Step 5: View the feature flag data in New Relic
After a few minutes, navigate to your Entities view for your OpenTelemetry services, and you’ll see a change in the error rate metrics for a few services. Click on the Error rate (%) column to sort your services by error rate; you should see the error rate increase over time and level out near what is shown in the following screenshot:
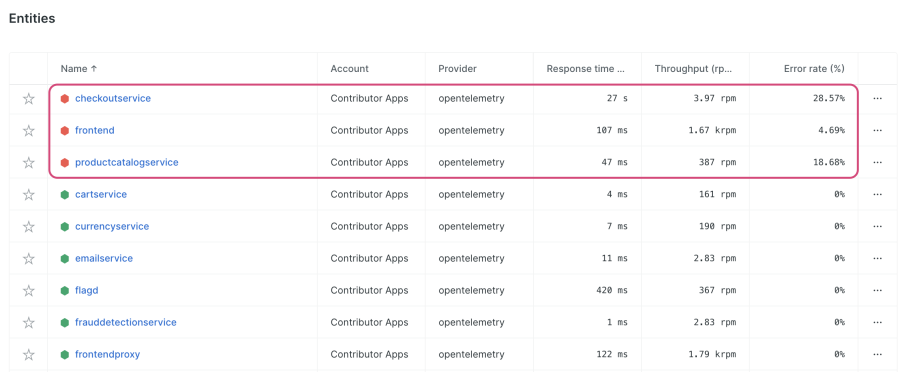
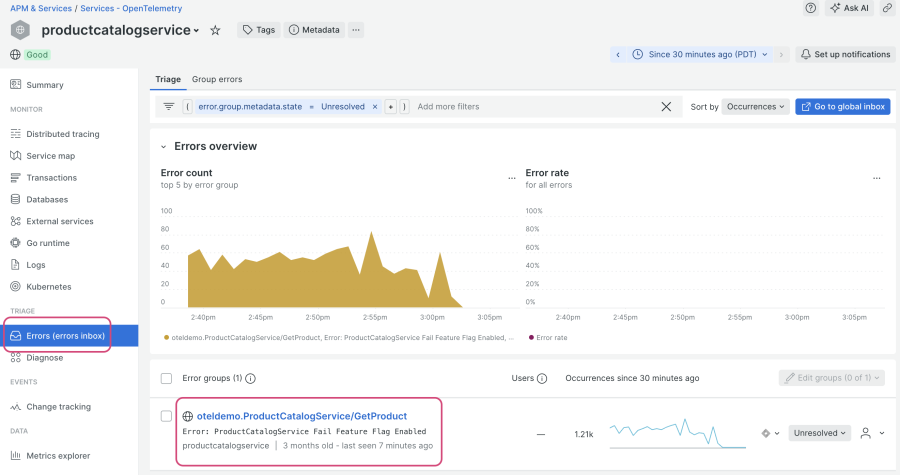
Let’s explore what’s going on. Click into productcatalogservice, and navigate to Errors inbox from the TRIAGE menu. You’ll see an error group with the message: “Error: ProductCatalogService Fail Feature Flag Enabled”:
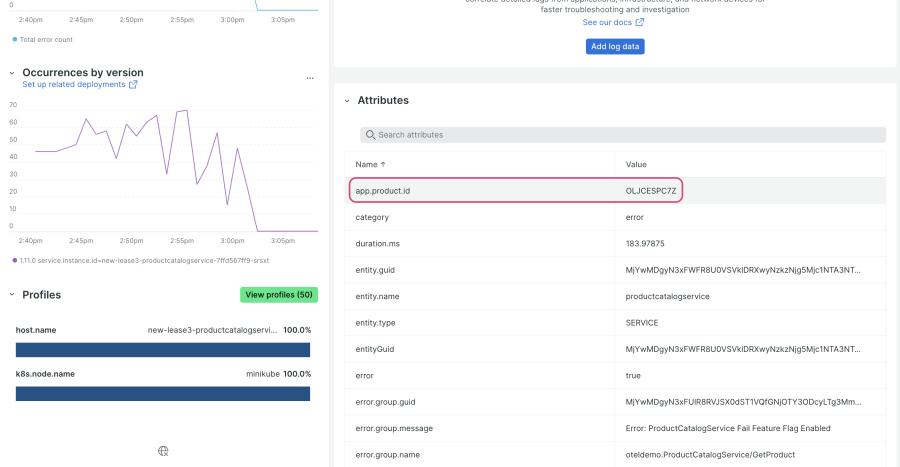
If you recall, the feature flag you enabled generates an error in productcatalogservice for “GetProduct” requests with the product ID “OLJCESPC7Z”. Click into the error group and scroll down; you’ll see that the product ID is collected as an attribute for these error traces:
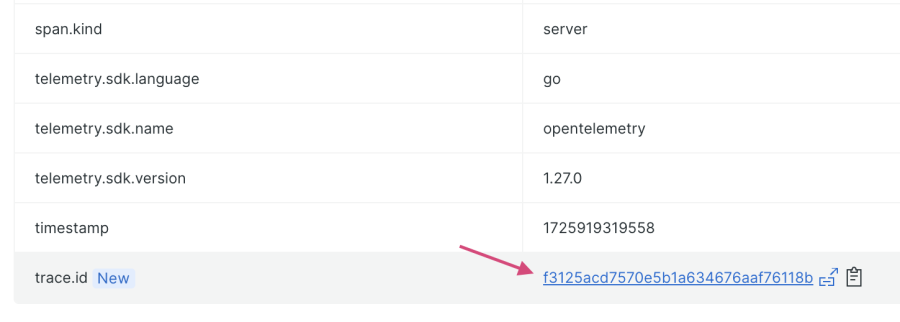
You can easily navigate to an example error trace in this view. Scroll to the bottom, and click on the linked trace provided as the value for the attribute “trace.id”:
The view that appears shows you an entire trace from this error group, including a map of the connected services. From the drop-down menu highlighted in the following screenshot, click on any of the error spans to explore them further:
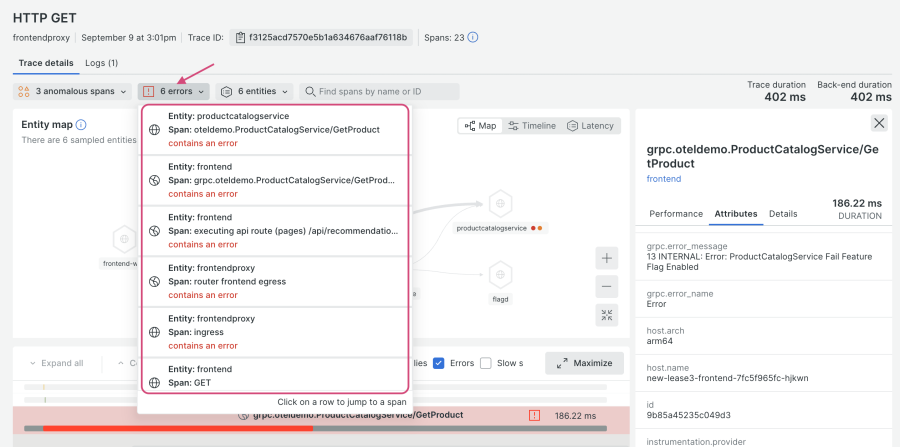
The frontend service calls productcatalogservice, but since the “GetProduct” requests with the product ID “OLJCESPC7Z” return an error, it results in a 500 for frontend service. You can see the source code via this link.
What about checkoutservice? Let’s navigate to that service and click on the Errors inbox page, where you’ll see the following error group:
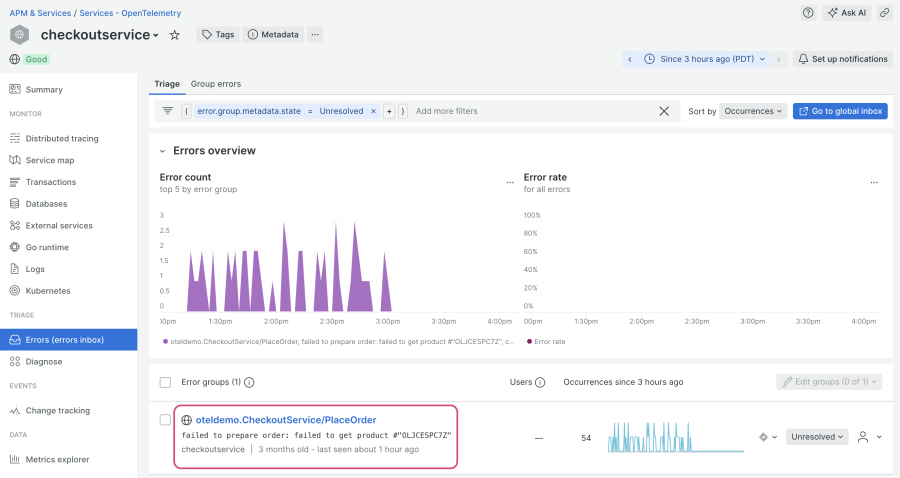
When you click into the error group, you can see that checkoutservice makes a call to productcatalogservice, and that the “PlaceOrder” call failed because an error was generated for the product ID “OLJCESPC7Z”:
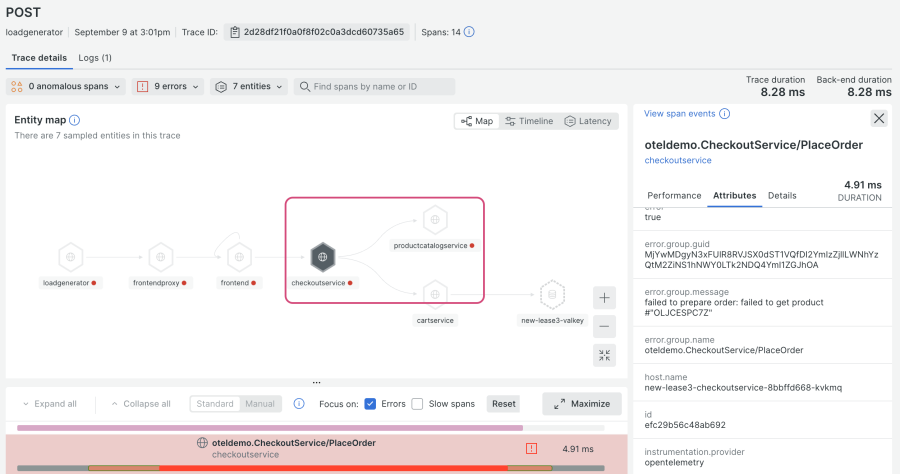
This demo scenario is a good example of how an error from one app can impact multiple services and multiple endpoints. Since this is a contrived error, there isn’t a lot of particularly useful troubleshooting information collected, but you can add custom instrumentation to collect a finer level of detail, such as error logs.
Use OpenTelemetry to monitor your Kubernetes cluster
In this section, we’ll cover how to use the nr-k8s-otel-collector Helm chart to monitor your cluster with the OpenTelemetry Collector. Note that this feature is still in development, and is provided as part of a preview program (please see our pre-release policies for more information). If you would like to use the New Relic Kubernetes integration instead, you can refer to this blog post.
With this Helm chart, you can observe your cluster using OpenTelemetry instrumentation and the New Relic Kubernetes UI, which is designed to be provider-agnostic. The data generated by the integrated Kubernetes components in the Collector automatically enhance New Relic’s out-of-the-box experiences, such as the Kubernetes navigator, overview dashboard, and Kubernetes APM summary page.
- In your code editor, navigate to the “helm” directory and create a new file named nr-k8s-values.yaml.
- Copy and paste the raw contents from this example values.yaml file into your newly created nr-k8s-values.yaml file.
- Make the following changes in your file:
- Install the chart:
helm repo add newrelic https://helm-charts.newrelic.com
helm upgrade nr-k8s-otel-collector newrelic/nr-k8s-otel-collector -f ./helm/nr-k8s-values.yaml -n newrelic --create-namespace --install
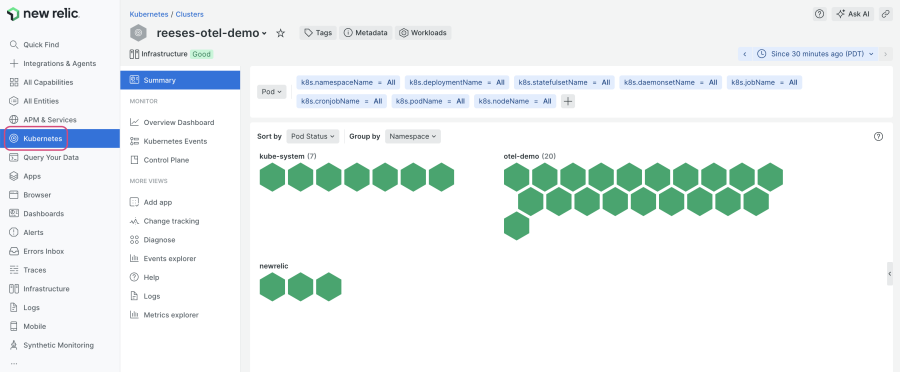
After a few minutes, you’ll be able to view information about your Kubernetes cluster in your New Relic account. If you didn’t modify the cluster name in an earlier step, you’ll see a cluster named “opentelemetry-demo” and be able to view your application pods with the namespace “otel-demo”. Navigate to Kubernetes in your account, and select your cluster to view your demo app pods:
If you’re familiar with our Kubernetes integration, you might notice that the metric names for your cluster monitored by OpenTelemetry differ from those of a cluster monitored by the Kubernetes integration, since they mostly come from kube-state-metrics. To get the list of metrics, navigate to Query Your Data and run the following query (replace the cluster name if needed):
FROM Metric SELECT uniques(metricName) WHERE k8s.cluster.name='opentelemetry-demo’ limit max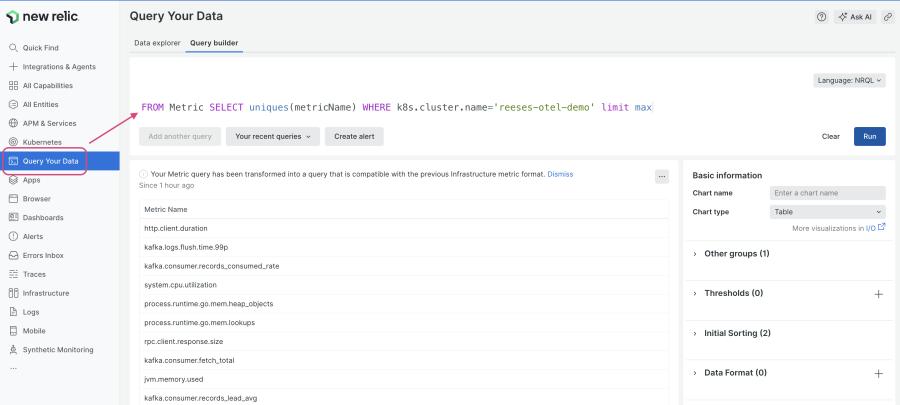
The current default Collector is NRDOT (New Relic Distribution of OpenTelemetry), but you can use other Collector distributions. We recommend including the following to properly enable our Kubernetes curated experiences:
What’s next for the fork?
Similar to how the demo app is under active development, we’re also actively developing and maintaining our fork. Here are a few things we’re working on, or have planned for the near future:
- Remaining demo scenario feature flags are in testing
- Troubleshooting tutorials for each demo scenario
- Add a feature flag to enable New Relic instrumentation for recommendationservice when using the Docker quickstart method
- A roadmap for the fork
If you have a suggestion or run into an issue while running our fork, please let us know by opening an issue in the repo.
다음 단계
In this blog post, you learned how to deploy the New Relic fork of the OpenTelemetry Community demo app to Kubernetes using Helm; enable a feature flag to simulate an issue with a specific product ID; navigate that data in your account; and install NRDOT to monitor your cluster.
If you would like to learn more, check out the following resources:
You can also follow this step to enable the New Relic agent for Python for recommendationservice to explore the interoperability between OpenTelemetry and New Relic instrumentation, as New Relic supports W3C trace context. (Note that this capability is only available if you deploy with Kubernetes.)
이 블로그에 표현된 견해는 저자의 견해이며 반드시 New Relic의 견해를 반영하는 것은 아닙니다. 저자가 제공하는 모든 솔루션은 환경에 따라 다르며 New Relic에서 제공하는 상용 솔루션이나 지원의 일부가 아닙니다. 이 블로그 게시물과 관련된 질문 및 지원이 필요한 경우 Explorers Hub(discuss.newrelic.com)에서만 참여하십시오. 이 블로그에는 타사 사이트의 콘텐츠에 대한 링크가 포함될 수 있습니다. 이러한 링크를 제공함으로써 New Relic은 해당 사이트에서 사용할 수 있는 정보, 보기 또는 제품을 채택, 보증, 승인 또는 보증하지 않습니다.


