Understanding log patterns is crucial for understanding application behavior and identifying potential issues. However, having too manylogs can make it challenging to manage and find relevant information.
The solution? Break logs into individual fields and remove unnecessary attributes using appropriate log-matching techniques and drop filters. That way, you can focus on critical data and gain valuable insights quickly. This blog will explore common log analysis techniques, highlight available resources, and offer practical suggestions on using drop filters to help you maximize the potential of New Relic.
Key takeaways
- Log patterns are a fast way to filter and analyze log data. You can use regular expressions (regex) tools to find and match text data patterns.
- Mastering regex can help you gain valuable insights into your application and infrastructure performance, troubleshoot issues and make data-driven decisions to improve system health.
- You can use regex with New Relic logs to quickly and effectively filter through large volumes of log data.
- Once log event data is sent to New Relic, it can be stored in our NRDB database or discarded. You can discard log data by creating drop filters using the logs management UI or GraphQL.
Understanding log patterns
Log patterns are the fastest way to filter and analyze log data, allowing you to match specific parts of your logs. Using log patterns, you can quickly isolate and analyze important data, such as errors or performance issues.
Log patterns use advanced clustering algorithms to automatically group similar log messages. With log patterns, you can:
- Quickly work through millions of logs.
- Enhance the efficiency of identifying abnormal behavior within your log estate.
- Monitor the occurrence of familiar patterns over time to focus your efforts on what truly matters while disregarding what doesn’t.
Analyzing logs is critical so you can understand application behavior and identify potential issues. However, an overwhelming amount of logs can make it challenging to find relevant information. To tackle this, you can break logs into individual fields and remove unnecessary attributes using appropriate log-matching techniques and drop filters. Then you can focus on critical data and gain valuable insights quickly. This blog will explore common techniques, highlight available resources, and offer practical suggestions on using drop filters to help you maximize the potential of New Relic.
Regular expressions for logs
Regular expressions (regex) are powerful tools for finding and matching text data patterns. They are commonly used in log analysis to filter records based on specific patterns or expressions, which makes finding and analyzing relevant data easier. A regex pattern is constructed using a combination of characters that match a specific set or range of characters.
Here is an example where the following regular expression is used to verify credit card numbers that start with a four and have a length of 13-16 digits:
^4[0-9]{12}(?:[0-9]{3})?$
Here's a breakdown of the regex:
^indicates the start of the string.4matches the first digit of the credit card number.[0-9]{12}matches 12 digits from 0-9 following the first digit 4.(?:[0-9]{3})?matches an optional group of 3 digits from 0-9 at the end of the string.$indicates the end of the string.
These patterns can be customized to match the exact text you're looking for in a log file, making it easier to identify relevant information and discard irrelevant data.
It's important to note that the pattern attribute in New Relic infrastructure works similarly to the grep -E command in Unix systems—it is only supported for tail, systemd, syslog, and tcp (only with format none) sources. The grep -E command is used in Linux and Unix systems to search for specific text or strings within a file. It explores the specified file for lines that match the selected words or strings.
Here is an example of a regular expression as seen in the New Relic docs to filter for records containing either WARN or ERROR:
- name: only WARN or ERROR
 file: /var/log/logFile.log
 pattern: WARN|ERROR
Here is another example of using a regular expression to filter NGINX containing either 400, 404, or 500:
logs:
 - name: nginx
   file: /var/log/nginx.log
   attributes:
     logtype: nginx
     environment: production
     engineer: yourname
   pattern: 500|404|400
For more information, read the docs on the log pattern attribute with New Relic infrastructure.
Mastering regex can help you gain valuable insights into your application and infrastructure performance. This can help you troubleshoot issues and make data-driven decisions to improve your overall system health.
In the next section, you will learn about client and server-side log filtering with New Relic.
Client-side log filtering using the pattern attribute
You can use regular expressions (regex) with New Relic logs to quickly and effectively filter through large volumes of log data. Here is an example of how to use the pattern attribute in the context of New Relic infrastructure:
Step 1: Set up New Relic infrastructure monitoring
You need to first install the New Relic infrastructure agent successfully and navigate to the log forwarder configuration folder. logging.d will be the main folder for all logs configuration, which you'll find in this location:
- On Linux:
/etc/newrelic-infra/logging.d/ - On Windows:
C:\Program Files\New Relic\newrelic-infra\logging.d\
Step 2: Define a log source
To configure log forwarding parameters for New Relic infrastructure monitoring, you need to include a name and log source parameter in the log forwarding .yml configuration file. Begin by defining a name for the log or logs you want to forward to New Relic.
logs:
 - name: example-log
   file: /var/log/example.log # directory to your log path
 - name: example-log-two
   file: /var/log/example-two.log # directory to another log path
The file field is used to specify the location of the log file(s) that the agent will monitor for changes. The agent tracks the changes in the log files in a way that is similar to how the tail -f shell command works.
Step 3: Add the pattern attribute
Add the pattern attribute to your logs configuration as seen with this NGINX example.
logs:
 - name: nginx
   file: /var/log/nginx.log
   attributes:
     logtype: nginx
     environment: workshop
     engineer: yourname
   pattern: 500|404|400
Step 4: View the results
Once you have configured New Relic correctly and confirmed that it is collecting data, you can view your log data and related telemetry data in New Relic. See the next image for an example of the end result of applying pattern to the status codes 500, 404, or 500 on NGINX. Now only logs with those status codes are shown in New Relic and this improves the overall quality of the logs received in New Relic.

With these steps, you can efficiently filter through vast amounts of log data via client-side and gain valuable insights into the performance of your application and infrastructure.
Server-side log filtering using drop filters
Once log event data is sent to New Relic, it can be stored in our NRDB database or discarded. You can discard log data by creating drop filters using the logs management UI or GraphQL.
What is a drop filter?
A drop filter is a special rule that matches data based on a query. When creating drop rules, make sure they accurately identify and discard data that meets your established conditions.
When triggered, the drop filter removes the matching data from the ingestion pipeline before it reaches the New Relic Database (NRDB).
For more information about drop filters, see How drop filters work in the New Relic documentation.

It's important to note that data removed by the drop filter rule cannot be queried and, once discarded, cannot be restored. Because of that, you must carefully monitor the filter rule(s) you create and the data you send to New Relic.
Here are the steps to create a drop filter from an attribute in New Relic:
Step 1: Navigate to logs
Go to one.newrelic.com and navigate to Logs. To open the log detail view of the log that contains the attribute you want to remove, click on All Logs, and then click on an individual log.

Step 2: Create a drop filter
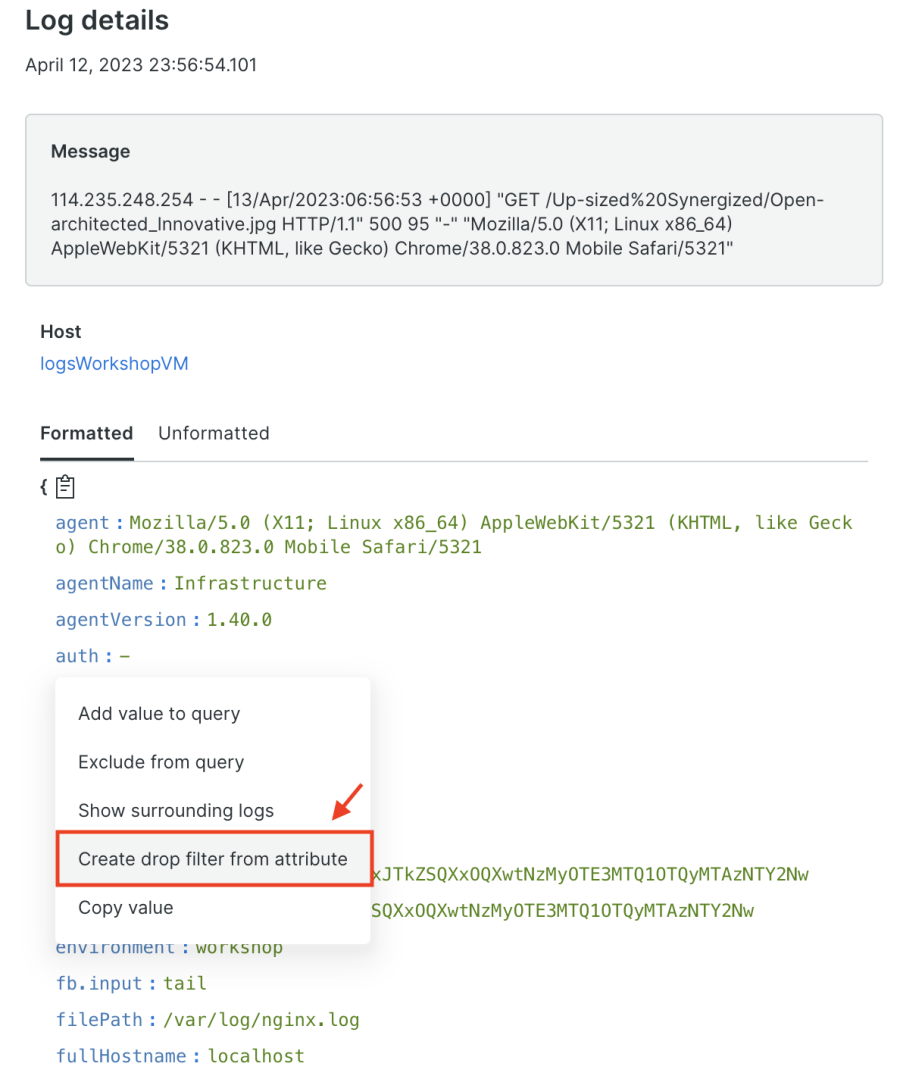
Within the log detail view, open the attribute menu by clicking on the desired attribute. For example, select auth. Then, select Create drop filter from attribute.

Step 3: Configure your filter
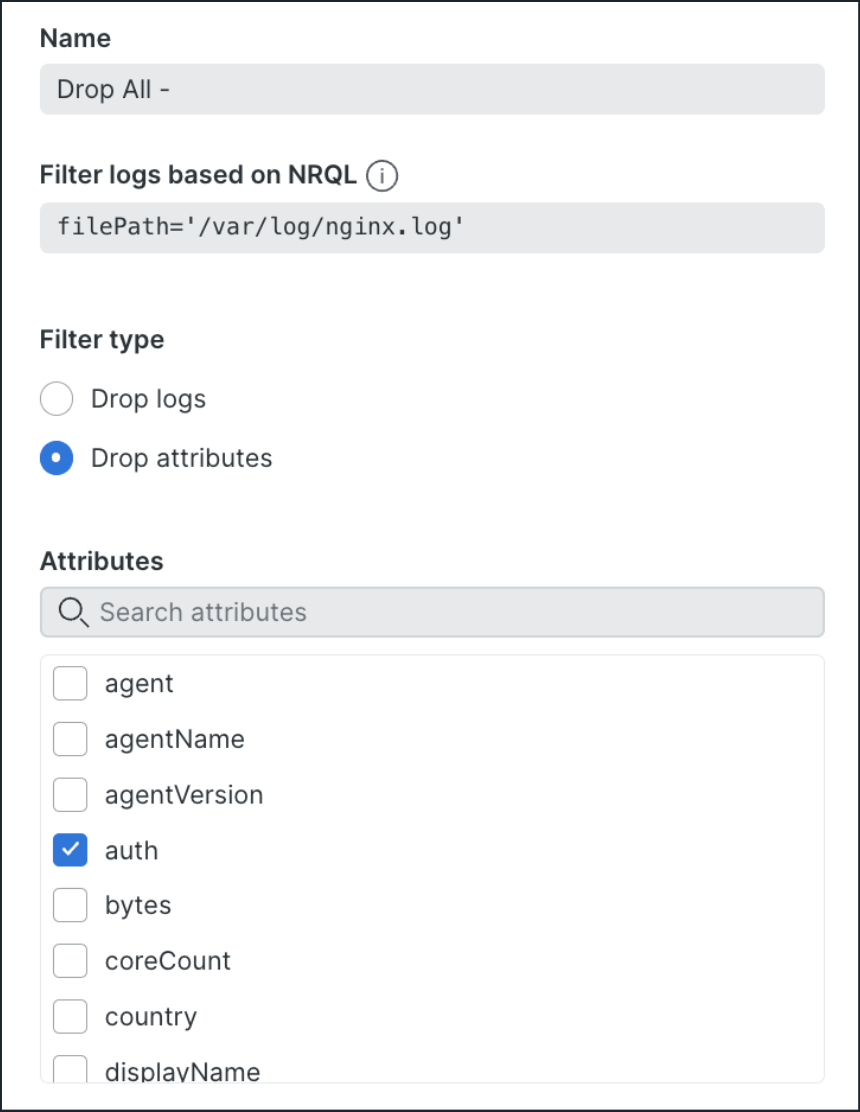
When creating a drop filter for your logs, it's important to give it a name that accurately describes what it does. The NRQL field will automatically be filled with the attribute's key and value based on your previous selection, but you can edit it if needed.

In this example, the filter is based on the filePath where the NGINX logs are received (you can also filter your NRQL queries with Regex). This field specifies the location of the log file(s) that the agent will monitor for changes. The agent tracks changes in the log files similarly to the tail -f shell command. You can then choose to drop the entire log event or specific attributes from matching events. Once you've decided, save the drop filter rule to finalize the process.
Step 4: See the before and after with drop filters
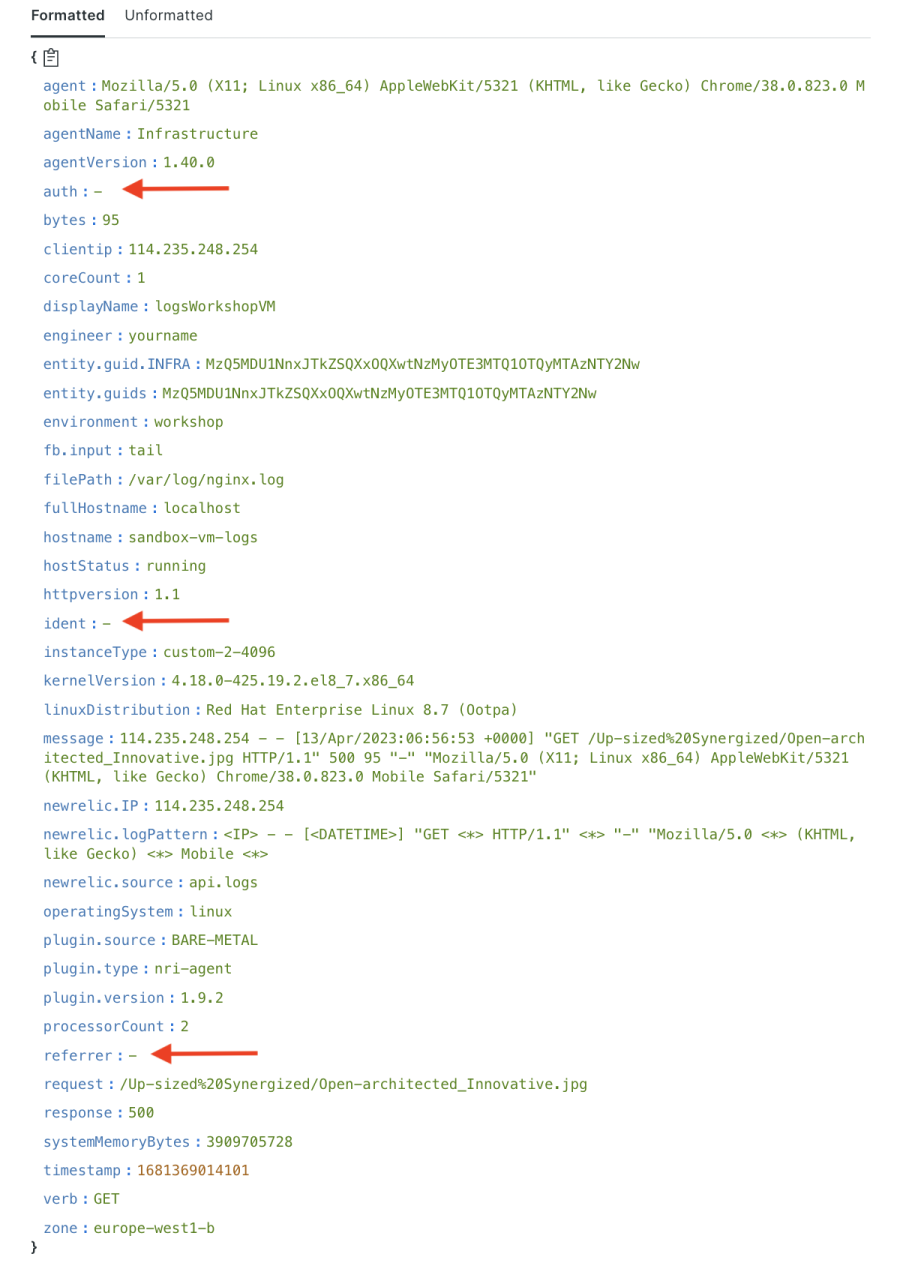
After correctly configuring New Relic and confirming that data is being collected, you can view the log data with the applied drop filters. Let's see how the log data looks before and after applying drop filters.

In the previous image, the attributes auth, ident, and referrer are recorded in New Relic before the drop filters are applied. These attributes can create unnecessary noise when dealing with many attributes or when the size of each log is huge.
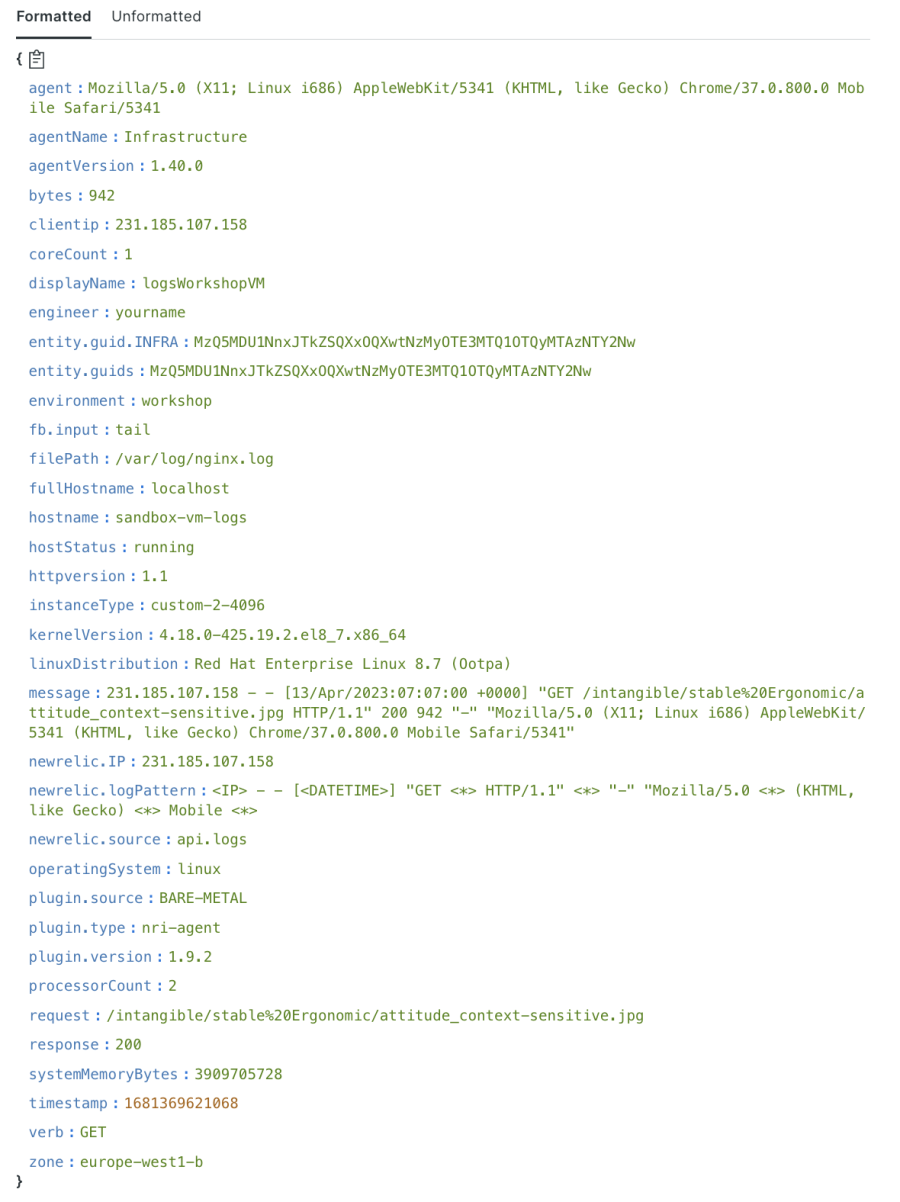
The next image shows what the log details looks like after drop filters are applied.

Notice how the drop filters have successfully removed the auth, ident, and referrer log attributes.
As you can see from this example, when you use drop filters, you can improve the quality of the logs received in New Relic by eliminating unnecessary information. This allows you to focus on the critical data relevant to your analysis so you can better understand the performance of your application and infrastructure.
Conclusion
In this blog, you learned how to improve log quality in New Relic by using the pattern attribute in New Relic infrastructure for client-side filtering, and using UI drop filters for server-side filtering to remove matching data during ingestion. These techniques allow you to remove unnecessary attributes, focus on critical log data, and maximize the potential of New Relic for log analysis.
For additional reading, check out these docs:
New to New Relic? If you’re not currently using New Relic, sign up for free. our account includes 100 GB/month of free data ingest, one free full-platform user, and unlimited free basic users.
이 블로그에 표현된 견해는 저자의 견해이며 반드시 New Relic의 견해를 반영하는 것은 아닙니다. 저자가 제공하는 모든 솔루션은 환경에 따라 다르며 New Relic에서 제공하는 상용 솔루션이나 지원의 일부가 아닙니다. 이 블로그 게시물과 관련된 질문 및 지원이 필요한 경우 Explorers Hub(discuss.newrelic.com)에서만 참여하십시오. 이 블로그에는 타사 사이트의 콘텐츠에 대한 링크가 포함될 수 있습니다. 이러한 링크를 제공함으로써 New Relic은 해당 사이트에서 사용할 수 있는 정보, 보기 또는 제품을 채택, 보증, 승인 또는 보증하지 않습니다.


