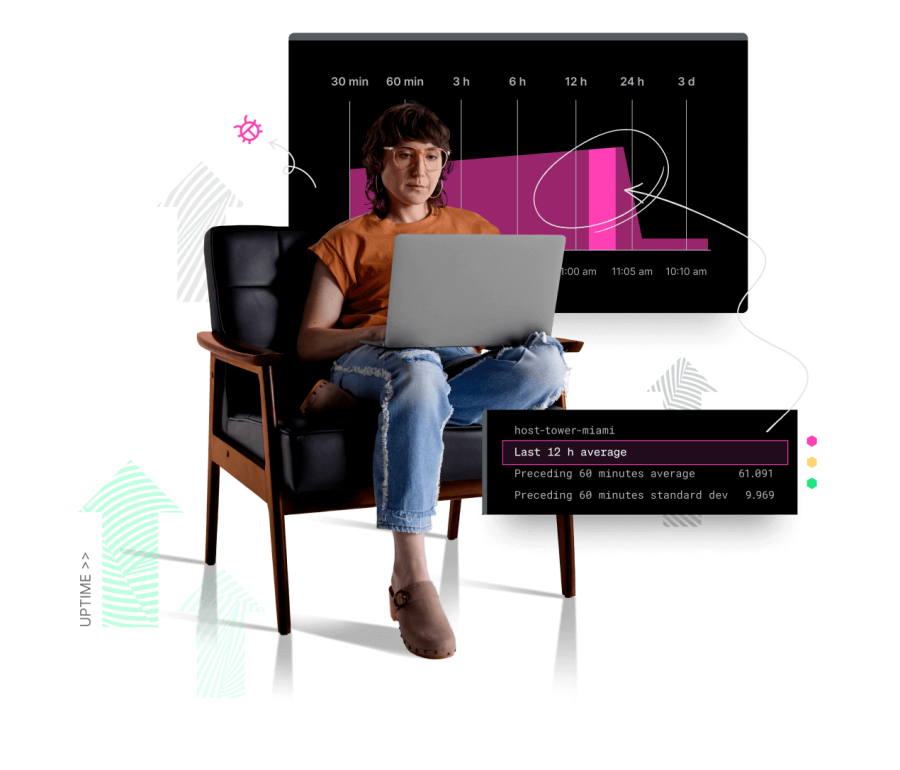
Uplevel uptime with infrastructure monitoring.
Go from zero to data with 780+ quickstarts.
Instrument your clouds instantly. Analyze all your telemetry in one place. Observe your full stack and troubleshoot faster.

Powerful tools
that show powerful results.
See all your telemetry in one place.
- Optimize AWS, Azure, and GCP cloud services at scale.
- Correlate infrastructure, application, and end-user data.
- Troubleshoot faster, find the root cause sooner.
Fix issues faster with 50+ monitoring tools in one platform.
- Speed through tasks with 50+ tools in 1 connected experience.
- Detect incidents, isolate bottlenecks, and achieve resolutions.
- Understand root cause, including Kubernetes clusters and workloads.
Scale up. Keep costs under control.
- Monitor and alert on cloud usage spikes and drops.
- Compare metrics across clouds to rightsize and optimize.
- Only pay for the telemetry you use, not the shelfware you don’t.
お客様の声

