現在、このページは英語版のみです。

How to Optimize Log Management Costs

Future-proof cloud adoption and avoid a data explosion doubling your bill.

How to Optimize Log Management Costs eBook main image

資料ダウンロード

Telemetry data—the biggest variable cost for observability

Why does telemetry data grow so fast? With accelerated cloud migration and digital transformation, telemetry data is typically the biggest variable cost for observability. As you shift from on premises (on prem) to the cloud and from a monolithic to microservices architecture, there can be hundreds of small services instead of a few large services.

Common scenarios include:

  • Moving workloads from on-prem or physical servers to cloud virtual machines (VMs)
  • Moving workloads from servers and VMs to Kubernetes (K8s) and containers
  • Re-architecting applications from monolithic to microservices
  • More frequent application releases
  • Blue/green deployments
  • Adopting serverless functions

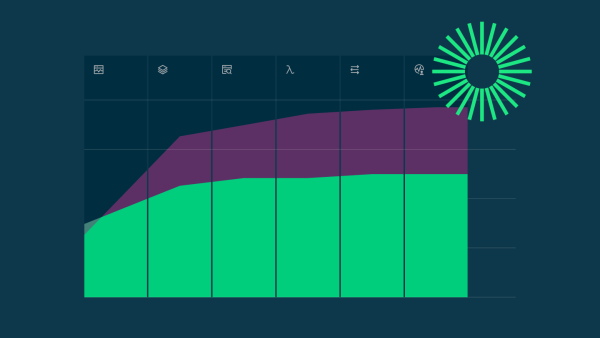
Customers generally report 2–10x telemetry data volume increases or more. And data can double every two to three years—a data explosion. The associated network, storage, and compute costs can add up quickly.

How cloud migration and digital transformation can increase telemetry data volume

Data explosion doubling your bill

A common challenge is that log volumes can be unpredictable when it comes to forecasting costs.

For example, consider these vendors’ pricing models:

  • System and user load along with unexpected code changes can cause Datadog log management costs to explode. Datadog has a complicated formula to calculate how logs are used that can add more than US$2.50–$3.75 per one million logging events for 30 days of retention. With an average of 1.5–2 GB per million events, that would be US$1.00–$2.50 per GB! That’s a lot more than the advertised data ingest rate of US$0.10/GB.1
  • Splunk charges approximately US$4.00 per GB for logs.2,3
  • Elastic charges per server in your Elasticsearch cluster and an increase of data loggings requires an increase in Elasticsearch servers.4

So, doubling your data ingestion can double your cluster size and costs.

Low incremental log management cost

It’s important to future-proof cloud adoption with an observability vendor like New Relic that offers a low data cost per GB. Keep in mind that some vendors may seem to have affordable pricing at first glance, but they can bury hidden costs, overage fees, and penalties in the contract terms.

This is best demonstrated with log data where customers have transitioned from legacy logging solutions to New Relic and realized significant savings. For example, Intelligent Growth Solutions (IGS) reduced monitoring and logging costs by 58% (from £20,000–£24,000 per month to £8,000–£10,000 per month).

Let’s take a look at how some other observability vendor log costs compare to New Relic.

Amazon CloudWatch vs New Relic

A comparison of log management costs shows that Amazon CloudWatch can be up to 2x more expensive than New Relic.

Amazon CloudWatch vs New Relic monthly log management cost comparison for 300 GB with 30-day retention

Datadog vs New Relic

The same comparison of log management costs shows that Datadog can be up to 4x more expensive than New Relic.

Datadog vs New Relic monthly log management cost comparison for 300 GB with 30-day retention

ELK vs New Relic

The chart below based on the underlying spreadsheet shows that Elasticsearch, Logstash, and Kibana (ELK) logs can be 2–3x more expensive than New Relic.

ELK vs New Relic monthly log management cost comparison for 10,000 GB

For example, Simply Business was using multiple tools for logs—including ELK—and was on track to spend a million dollars per year on observatory tools alone, which was unsustainable and lacked the return on investment (ROI) to justify it. After switching to New Relic log management, former DevOps engineer Mikio Tsunematsu at Simply Business said, “Focusing on one tool has saved us money as well as mental energy.”

Sumo Logic vs New Relic

The chart below based on the underlying spreadsheet shows that Sumo Logic logs can be 2–4x more expensive than New Relic.

Sumo Logic vs New Relic monthly log management cost comparison for 5,000 GB, 10,000 GB, and 30,000 GB

Optimizing data ingest

In addition to a low incremental log management cost, your logging solution should offer ways to optimize your data ingest so you only pay for what you use.

Data-dropping rules

To reduce the amount of data ingested (and data ingest bills), you should be able to manage your data ingest by configuring data-dropping rules that filter out unimportant, low-value, or superfluous data and potentially sensitive data.

Logs-to-metrics rules

Logs contain a lot of information that you may only need to retain for a short period and summarize into metrics to track long term. Ensure your vendor supports logs-to-metrics rules (creating metric data from non-metric data) that deliver the best of both worlds at an optimal cost.

Querying, tracking, and alerting capabilities

Querying, tracking, and alerting on billing-related usage is a best practice because it makes accurate sizing and pricing easier. For example, you should be able to create an alert when data usage exceeds a fixed monthly threshold for gigabytes. Unfortunately, not all observability vendors provide these capabilities, so ask whether they do and, if so, how.

The New Relic advantage

New Relic is a unified telemetry data platform where all MELT are stored together in a single data store, enabling you to correlate all of your telemetry data across your entire stack in one place. Whether you’re navigating application performance monitoring (APM), infrastructure, Kubernetes, or traces, your logs are right there. You can search through log files quickly with its highly-scalable platform and find relevant, in-context log data throughout the platform alongside the rest of your telemetry data. Using its curated UIs, you can detect and resolve issues even faster.

Usage-based pricing and billing

New Relic prices its all-in-one observability platform based on just two core metrics—users (one of the most stable pricing units) and data ingest (at a low cost per GB of data ingested starting at just US$0.30/GB that includes up to 30 days of data retention)—with no penalties for scaling.

In contrast, most other observability vendors price based on the underlying infrastructure and data ingest. So doubling infrastructure and data with other vendors could double your bill, while the New Relic cost would only increase by 30%, on average, because data typically grows much faster than staff headcount.

Your provisioned users automatically get access to 30+ capabilities—including log management—so all your data, tools, and teams are in one place. Its usage-based billing model means you only pay for what you use (no peak billing!). And the platform includes capabilities to help you manage data ingest and query, track, and alert on billing-related usage.

New Relic is changing the economics of observability by empowering companies to leverage all available telemetry at a dramatically lower cost than before.

Making the switch

There’s no time like the present to review alternative observability solutions—such as New Relic—and evaluate whether they better meet your log management needs. New Relic can help your development and operations (DevOps and ITOps) teams switch from siloed monitoring tools to a powerful, all-in-one observability platform.

More than 15,000 New Relic customers already experience business value from the New Relic observability platform, and you could too.

Here are a few really powerful case study examples of the business value New Relic customers have experienced:

  • IGS reduced monitoring and logging costs by 58% (from £20K–£24K per month to £8K–£10K per month).
  • 27Global cut the time to stand up a new project in half and saved US$1,500 per month.
  • Gett reduced MTTD from five minutes to under two minutes, reduced MTTR by 50%, and cut costs.
  • Chegg reduced MTTR from 197 minutes to 24 minutes in one year.
  • PicPay improved its total downtime by 51% and MTTR by 30%.

Having a single view with New Relic is a lifesaver for me. When we tie logs to an application and try to figure out the contributing factors, I can go to one spot instead of three different tools like before.

Capabilities
New relic virtuo customer story
Discover the power of New Relic log management
Manage your logs Manage your logs

Resources

Amazon Web Services (AWS). n.d. “Amazon CloudWatch Pricing.” Amazon AWS. Accessed March 21, 2023. https://aws.amazon.com/cloudwatch/pricing/.

Datadog. n.d. “Datadog Log Management Pricing.” Datadog. Accessed March 17, 2023. https://www.datadoghq.com/pricing/?product=log-management#log-management.

Elasticsearch. n.d. “Elastic Cloud Value Estimator.” Elastic. Accessed March 31, 2023. https://www.elastic.co/cloud/value-calculator.

Elasticsearch. n.d. “Elastic Pricing FAQ.” Elastic. Accessed March 17, 2023. https://www.elastic.co/pricing/faq.

Splunk. n.d. “Splunk Observability Pricing.” Splunk. Accessed March 17, 2023. https://www.splunk.com/en_us/products/pricing/observability.html.

Splunk. n.d. “Splunk Observability SC Bundle.” Splunk. Accessed March 17, 2023. https://www.splunk.com/en_us/legal/o11y-sc-bundle.html.

Sumo Logic. n.d. “Sumo Logic Pricing Tiers.” Sumo Logic. Accessed March 31, 2023. https://www.sumologic.com/pricing/tiers.

View this ebook to learn how to future-proof your cloud adoption and avoid high data bills. Topics include:

  • The definition of telemetry data and why it's the biggest variable cost for observability
  • How doubling your data ingest can double your bill
  • The importance of a low, incremental data cost per GB
  • Common observability billing and pricing traps
  • A logs cost comparison for Amazon CloudWatch vs New Relic, Datadog vs New Relic, ELK vs New Relic, and Sumo Logic vs New Relic
  • How to optimize your data ingest
  • The advantages of usage-based pricing and billing