What's included?
dashboards
1
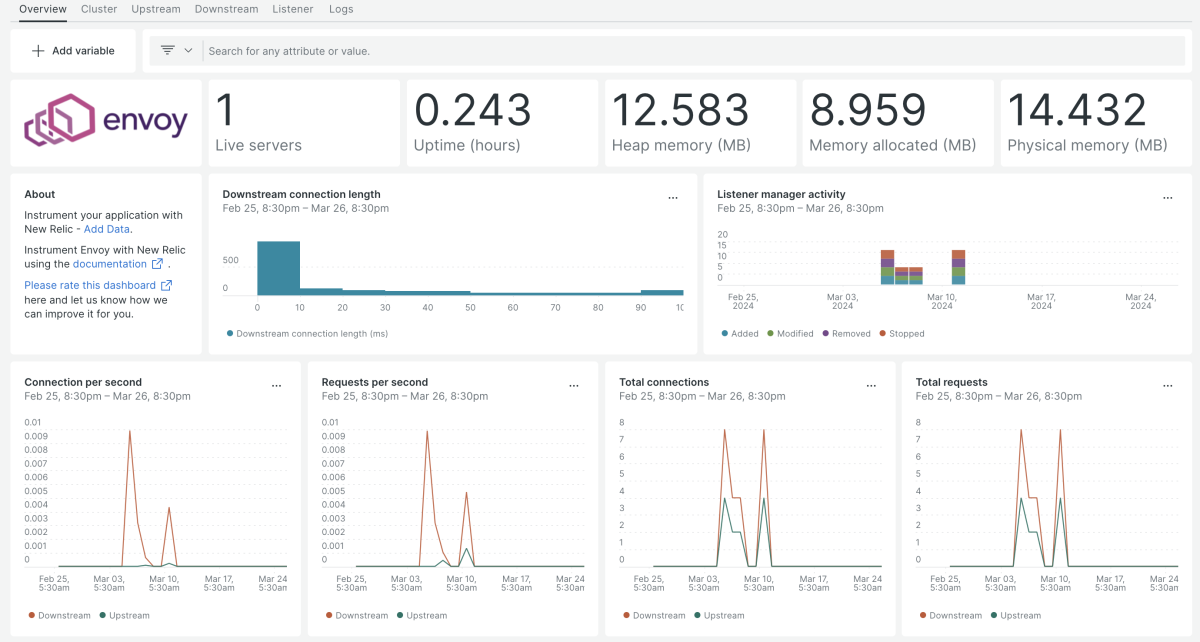
Envoy quickstart contains 1 dashboard. These interactive visualizations let you easily explore your data, understand context, and resolve problems faster.
Envoy
alerts
4
Envoy observability quickstart contains 4 alerts. These alerts detect changes in key performance metrics. Integrate these alerts with your favorite tools (like Slack, PagerDuty, etc.) and New Relic will let you know when something needs your attention.
Downstream timed out requests
This alert is triggered when the number of downstream timed out requests exceeds 5 for 5 minutes.
Cluster update failed
This alert is triggered when at least one cluster update has failed for 5 minutes.
Cluster bind errors
This alert is triggered when at least one cluster bind errors is triggered for 5 minutes.
Draining listener
This alert is triggered when there is at least one draining listener for 5 minutes.
documentation
1
Envoy observability quickstart contains 1 documentation reference. This is how you'll get your data into New Relic.
Why monitor your Envoy?
Monitoring Envoy helps ensure the reliability, performance, and security of your microservices architecture, enabling you to deliver a seamless experience to your users and customers.
Comprehensive monitoring quickstart for Envoy
The Envoy quickstart involves setting up a robust monitoring infrastructure to track the performance, health, and resource utilization of Envoy proxies effectively. Additionally, setting up alerts and notifications based on predefined thresholds or patterns in metrics data ensures proactive monitoring for anomalies and critical events.
What’s included in the Envoy quickstart?
New Relic Envoy monitoring quickstart ability to cover quality on out-of-the-box reporting.
- Dashboards (Active downstream and upstream connections, Active and warming cluster, Listener manager activity and more)
- Alerts (Cluster bind errors, Downstream timed out requests and Draining listener)


