Introduction
Observability has become an important practice for modern digital enterprises. No other strategy so effectively enables engineers to deliver excellent customer experiences with software, despite the complexities and distributed nature of their application and infrastructure landscape.
But before we go any further, let’s get two things out of the way:
1. Observability is not a fancy synonym for monitoring.
Monitoring gives software teams instrumentation, which collects data about their systems and allows them to quickly respond when errors and issues occur. Observability, on the other hand, is the practice of instrumenting those systems with tools to gather actionable data that provides not only the when of an error or issue, but, more important, the why.
2. Observability must be end-to-end, providing visibility into the entire landscape.
From the experience of the frontend UI to the container resources configured for Kubernetes deployments, you must apply the principles of full-stack observability to your full IT environment.
With full-stack observability, modern software teams are better equipped to:
- Deliver high-quality software at speed and scale
- Build a sustainable culture of innovation
- Optimize investments in cloud and modern tools
- See the real-time performance of their digital business
Full-stack observability bridges the gaps between site reliability engineering (SRE) and DevOps teams, developers, and business leaders.
So, how do you establish full-stack observability in your environment? And what results can you expect when you achieve it? Read on to learn about the three core elements of full-stack observability.

Architectures Require a New Approach to Observability
The rate of technological innovation over the past five to 10 years has been mindboggling, and it has had a tremendous impact on software teams. Key trends include:
Pressure to innovate fast
Software teams face enormous pressure to rapidly and frequently ship new features and experiences to market faster than the competition. The cloud has grown the competitive landscape by lowering the barrier to entry, demanding that software teams deliver and adapt faster than ever—often doing so with fewer resources. High performers deploy software between once per hour and once per day, with elite performers deploying on demand multiple times per day.
Higher customer expectations
Customers expect more and tolerate less. Slow, error-prone, or poorly designed user experiences are non-starters with customers. If they can’t do what they came to do, they won’t come back. According to mobile app developer Dot Com Infoway, 62% of people uninstall an app if they experience mobile crashes, freezes, or errors. Elite performers in software delivery performance restore service in the event of an incident or defect that impacts users in less than one hour, compared with low performers who take between one week and one month to restore service.
More technology options
Today, organizations build microservice architectures and distributed systems on any number of cloud providers and compute platforms. These services are easier than ever to adopt and use, and increasingly work together seamlessly. You can pick and choose various systems and services to support everything you need in a modern technology stack while abstracting away the management effort to configure and maintain the stack.
The rise of DevOps and automation
Companies are organizing around autonomous teams responsible for the end-to-end design, delivery, and operation of services they own in production. They sometimes leverage common platforms and tooling that are provided as services by internal platform teams. Automation reduces repetitive, low-value work (toil) and improves reliability. In a cloud native architecture, everything in the stack is controlled by software; the entire surface area can be configured via code. And because all that automation is software, it can fail. Teams need to monitor their continuous integration/continuous delivery (CI/CD) and other automation tooling exactly as they would applications that directly serve their customers. Gathering data about every component within a system is the essence of observability.
These trends are creating four major challenges that drive the need for full-stack observability of modern systems:
1. Greater complexity
While cloud native technologies have transformed the way applications are built, delivered, and operated, they’ve also created more complexity for the teams responsible for maintaining them. As monolithic applications are refactored into microservices, where the lifetime of a container may be measured in minutes or less, suddenly software teams have services that are constantly changing. Since each individual application is deconstructed into potentially dozens of microservices, operations teams face a complexity of scale; they’re now responsible for services they know little about yet must maintain.
2. Higher risk
Frequent deployments and dynamic infrastructure means introducing more risk more frequently. This increased risk makes instant detection and rollback much more important than in the days of infrequent deployments. And as companies adopt agile practices and continuous delivery to ship software faster, they’re adding yet another surface area of software (via delivery tools and pipelines) that must be monitored and maintained.
3. Skills gaps
The explosion of microservices architectures has introduced new challenges as software teams must rethink how they design, build, and deploy applications. Each team member must also understand and be able to troubleshoot parts of an application they weren’t previously familiar with; today a database expert, for example, must know about networking and APIs as well. The downside is that the number of new and different technologies that teams must learn to use are too vast for any one person to master. Teams need ways to better understand those technologies in context of the work they accomplish.
4. Too many tools
Hybrid environments, thousands of containers in production, and multiple deployments per day result in huge volumes of operational telemetry data. Juggling multiple monitoring tools and the necessary context switching to find and correlate the data that matters most, or to find and resolve issues, takes up precious time that teams don’t have when their customers are impacted by a production problem.
Given these trends and challenges, as well as the overall rate of technological change, teams need a single solution that reduces complexity and risk, and that does so with speed and low overhead. A full-stack observability solution must close the skills gap and be easy to use, understand, and navigate through when gathering essential context. The solution must allow any team within an organization to see all of their telemetry data in one place and get the needed context to quickly derive meaning and take the right action.

The Core Elements of Full-Stack Observability
So let us clarify what we mean when we refer to full-stack observability:
Full-stack observability is every engineer’s single source of truth as they troubleshoot, debug, and optimize performance across their entire stack. Users can find and fix problems faster in one unified experience that provides connected context and surfaces meaningful analytics—from logs, infrastructure and applications, distributed tracing, serverless functions, all the way into end-user experience—without having to onboard new tools or switch between them.
To achieve full-stack observability of your systems, we believe you need three core elements:
1. A single (open) source of truth
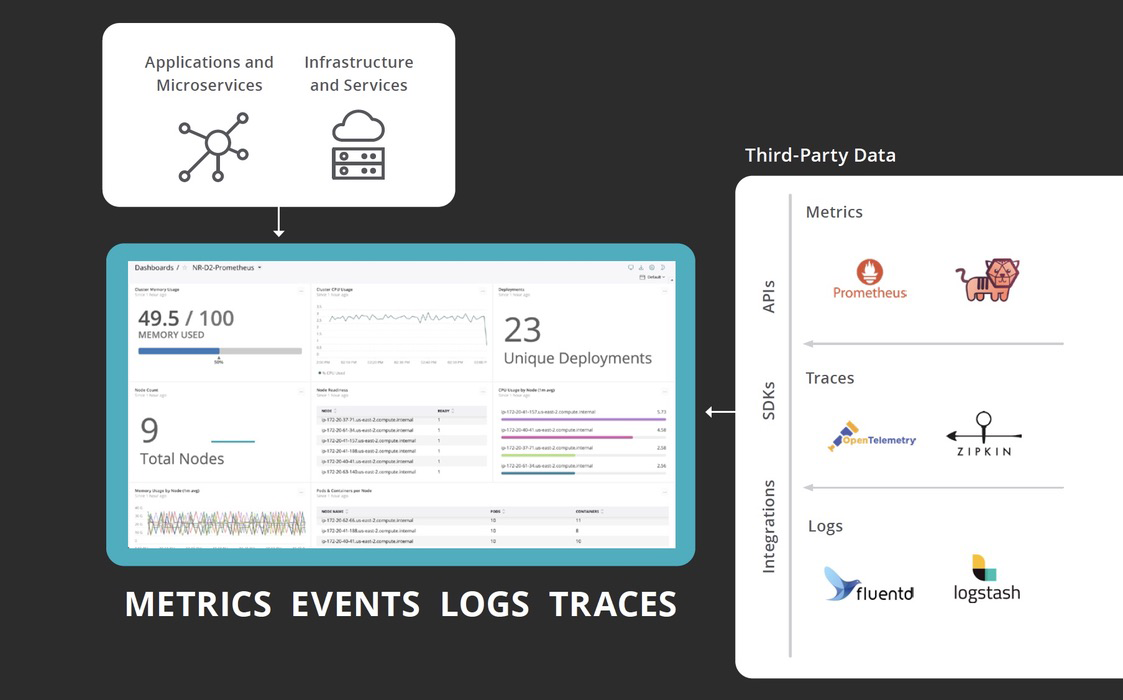
Full-stack observability relies on ingesting any telemetry data you want (metrics, events, logs, and traces) from any source within your environment, from the frontend UI to the infrastructure layer, without worrying how to scale or context- switch between multiple tools.
2. Connected context
When you access metrics about the health of your services, you should be able to see how that service affects workloads, how those workloads are affected by the Kubernetes cluster that hosts them, and vice versa. And you should be able to understand how the issue between the cluster and the app is affecting the end-user experience on your company’s website or e-commerce portal or mobile app—all from one place.
3. Easier, faster, and more customizable exploration
You ingest telemetry data from dozens of sources, and you add context to better understand interdependencies and upstream/downstream effects of issues. Finally, you need the proper visualizations—that require zero configuration to start discovering insights—to speed your exploration and troubleshooting. A fullstack observability platform should present all your telemetry data on one screen, from everywhere, in real time. In addition, the platform should also allow you to build applications on top of your telemetry data that exposes insights into your specific landscape. For example, you could build an application that tracks the cost of errors and failures in a business process, attach real dollars in aggregate to those failures, and provide a path to drill into the data to find the reason why.
A Single (Open) Source of Truth
For many years, the best way to collect telemetry for observability was through agents. Software developers and operations teams deployed agents inside their applications and hosts, and these agents would collect metrics, events, traces, and log data, package it up in proprietary ways, and send it for aggregation and display.
Although that continues to be an effective route for collecting telemetry today, the industry has changed. Now there are many more sources of telemetry. Many open systems and frameworks for software development have built-in metrics, events, logs, and traces that they emit in common formats.
For full-stack observability, you need to collect data from both open and proprietary sources and combine it in one place. You need to automatically apply instrumentation wherever it makes sense, and add instrumentation where you need visibility the most.
M.E.L.T: A quick breakdown
At New Relic, we believe that metrics, events, logs, and traces (or MELT) are the essential data types of observability. Here’s a brief overview of each.
Metrics
Metrics are the starting point for full-stack observability. They are low overhead to collect, inexpensive to store, dimensional for quick analysis, and a great way to measure overall health. Because of that, many tools have emerged for metric collection, such as Prometheus, Telegraf, StatsD, Dropwizard, and Micrometer. An “open” full-stack observability solution needs to be able to consume metrics from any of these sources that diverse teams have adopted in the modern digital enterprise.
Events
Events are a critical (and often overlooked) telemetry type that must be part of any full-stack observability solution. Although events and logs share some similarities, the two are often mistakenly conflated. Events are discrete, detailed records of significant points of analysis. But they contain a higher level of abstraction than the level of detail provided by logs. Logs are comprehensive and discrete records of everything that happened within a system; events are records of selected significant things that happened with metadata attached to the record to sharpen its context. For example, when New Relic collects transaction events—individual instances of the execution of a method or a code block in a process—data is automatically added to show the number of database calls executed and the duration of those calls.
Logs
Logs are important when an engineer is in “deep” debugging mode, trying to understand a problem. Logs provide high-fidelity data and detailed context around an event, so engineers can re-create what happened millisecond by millisecond. Just as with metrics and traces, tools have emerged to reduce the toil and effort of collecting, filtering, and exporting logs. Common solutions include Fluentd, Fluent Bit, Logstash, and AWS CloudWatch, as well as many other emerging standards.
Traces
Traces are valuable for showing the end-to-end latency of individual calls in a distributed architecture. These calls give specific insight into the myriad customer journeys through a system. Traces enable engineers to understand those journeys, find bottlenecks, and identify errors so they can be fixed and optimized. Like with metrics, different tools (Jaeger, Zipkin, AWS X-ray, etc.) and standards (W3C Trace Context and OpenTelemetry project, for example) have emerged, allowing sophisticated organizations to create custom solutions.
The importance of a unified datastore
While most open source tools that provide essential instrumentation also come with a discrete data store for collecting, storing, and making data available for analysis, this undermines the utility of full-stack observability: It forces engineers and teams to know and understand multiple tools. Without a unified datastore, when issues (or worse, emergencies) arise, engineers need to context-switch through multiple tools to find the source of the problem. An open full-stack observability platform has interoperability of all this data, irrespective of the source.
However, trying to handle all this data on your own will only present another set of challenges. Are you recording the right data in the right formats? Is your data pipeline big enough to handle the load as demand on your software increases? Full-stack observability should reduce anxiety instead of adding to it.
To that end, a full-stack observability platform should provide a unified database that:
- Gathers all your telemetry data in one place, giving you a connected view of all the data points in your system, so you can identify, understand, and resolve the issues that impact your business
- Is built on a flexible schema, so you can quickly get answers to questions you never had to ask before • Scales as your business grows, and does so without limits to support any unpredictable demands on your business
Connected Context
Getting telemetry data from virtually anywhere into one place is a good start, but it isn’t enough. Your data needs to be connected in a way that lets you understand relationships between system components, and it needs to be correlated with metadata so you can understand its relationship to your business. Such connections give your data context and meaning.
Context, for example, leads to curated views that surface the most important information about your data, and model its specific environment. Additionally, when all of your telemetry data and connections are stored in one place, you can apply intelligence to those very large data sets, and surface patterns, anomalies, and correlations that are not easily identifiable by humans watching dashboards.
Essentially, you need a way to see how all components in your system are related to one another at any moment in time. It’s simply not feasible to maintain a mental map of your system when it changes by the day, hour, or minute. Nor is it feasible to rely on configuration to manage those relationships. As teams add new services, refactor old ones, and spin up and shut down ephemeral application instances, it becomes impossible to maintain a mental map.
Context relies upon metadata and dimensions. Depending on your system, business, or application, the spectrum of valuable data is potentially enormous. For example, in the case of an e-commerce application, helpful context includes, but isn’t limited to:
- Details about the team that owns the application, runbook, and code repository
- Tags from Docker or the cloud provider where it’s deployed
- Its service type and function
- The regions where it has been deployed
- Its upstream and downstream dependencies
- Its deployment or change events
- Its alert status
- Any trace or log data associated with the transactions it performs
- Additional business data (e.g., cart value)
But system components, their connections, and relationships are only one part of essential context for full-stack observability. Context is nothing without useful visualizations.

Easier, Faster, More Customizable Exploration
Curation of data visualizations is a powerful way to surface data from connected and well-defined system components. We already know how best to represent a Java application process running in a container, or an AWS Lambda function that calls DynamoDB after a call from SQS, or a Kubernetes cluster running a dynamic deployment— we’ve solved these problems. And for a busy SRE or DevOps engineer, modeling those environments in a set of dashboards is a waste of valuable time. Manually creating visualizations and dashboards for specific and ubiquitous technology is toil, plain and simple.
A full-stack observability platform must incorporate the best practices from industry leaders and surface the most important signals of health as well as provide interactive experiences that let engineers troubleshoot problems quickly.
To efficiently traverse large, complex, distributed systems and quickly understand and prioritize any issue, you’ll need intuitive visualizations that require zero configuration. In light of this, innovative design is essential.
When a platform’s visualizations provide insight without requiring configuration, organizations are better prepared to break down silos and enable teams to observe their entire system—at a glance—and more quickly understand what’s happening across their environment and resolve issues faster.
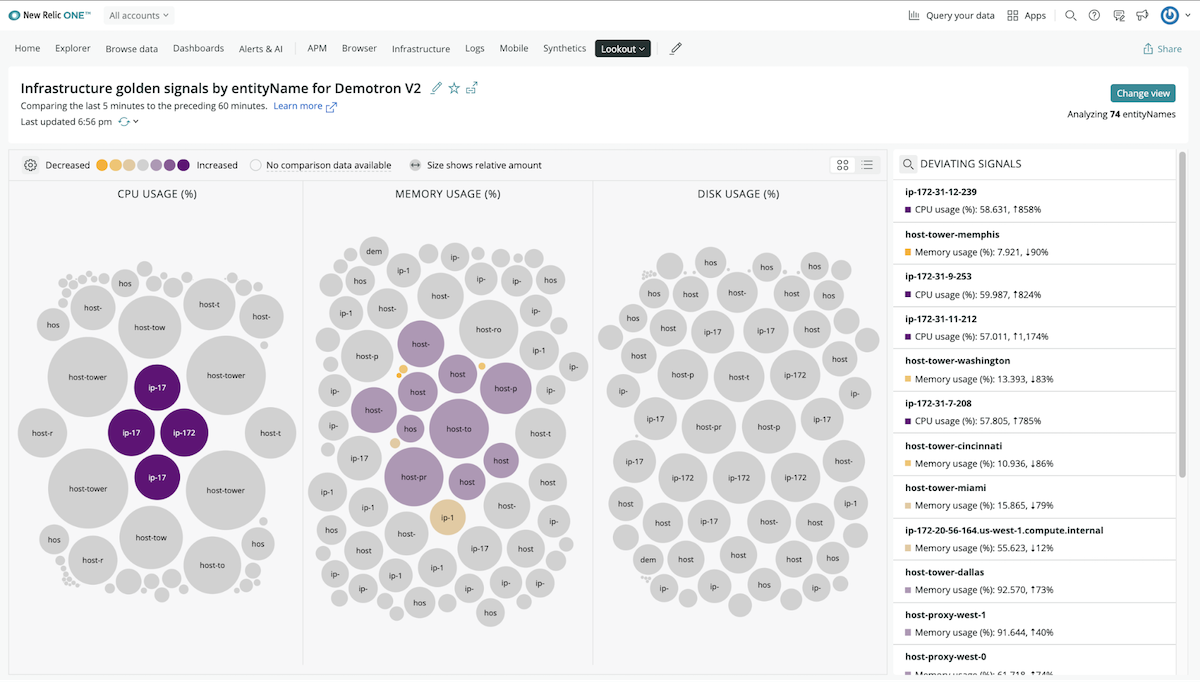
In New Relic Lookout, important changes in infrastructure golden signals are surfaced via circle visualizations, with color indicating severity and size conveying the scale of recent changes.
Dashboards are great tools, but they often provide passive data. A full-stack observability platform should provide intuitive, real-time visualizations that drive your attention to where it’s needed most and convey the severity and scale of recent changes across all your telemetry data. This allows you to discover unknown relationships and blind spots. And these views should be customizable, so you can easily explore large systems, from the “golden signals” of throughput, response time, and errors to changes in any signal in your telemetry data that is important to you.
These visuals—as jumping-off points—show you where changes are occurring and what may be contributing to those changes. You’ll immediately see how issues across the system are related as well as any commonalities that exist. Saved views give your teams added efficiency and collaboration when troubleshooting.
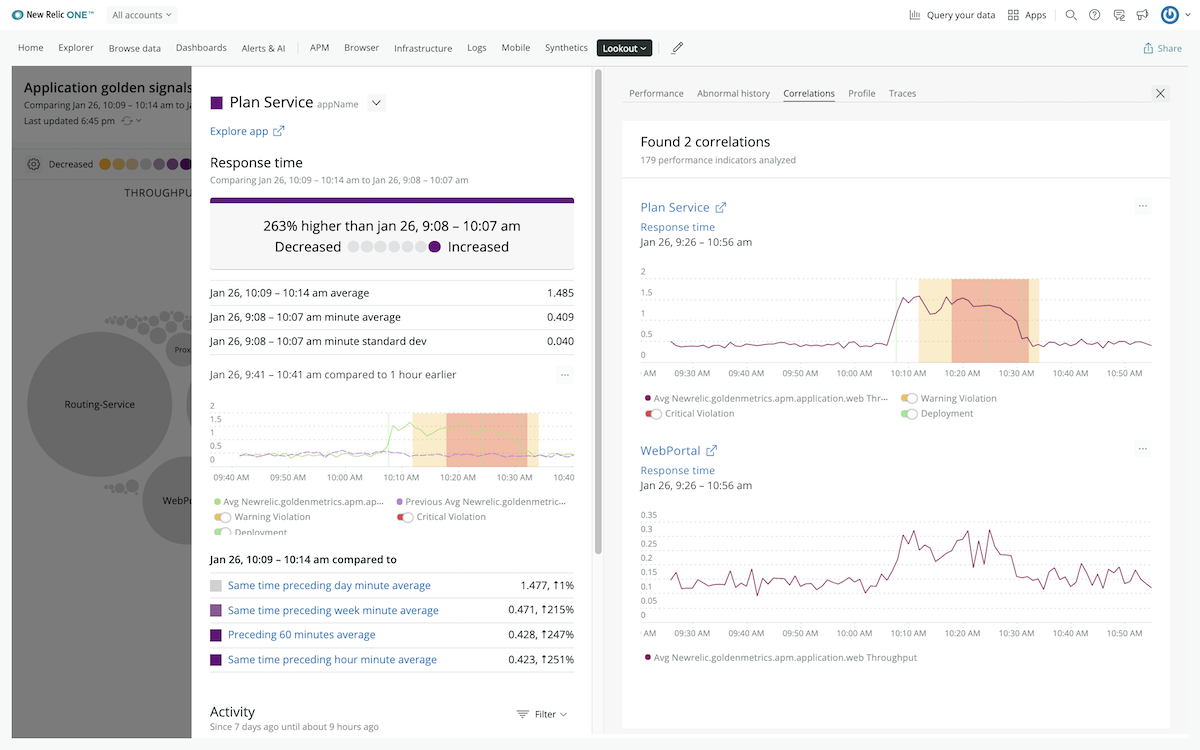
New Relic Lookout additional analysis highlighting deployments, warnings, and critical violations, and any correlations.
A platform that intuitively displays the entire landscape on a single screen allows teams to quickly explore the health of their environment at a glance, with point-and-click filtering and grouping for all system components based on types, tags, or critical performance data. This helps you understand what has changed and why, so that issues can be resolved long before they impact the customer.
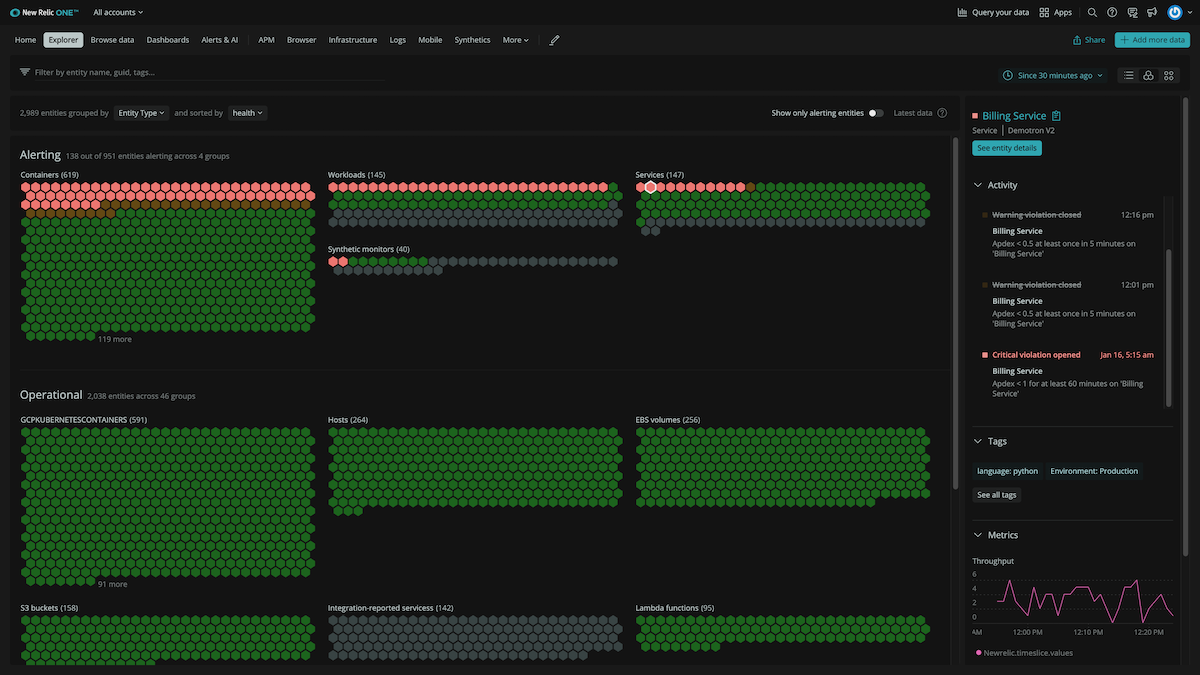
Easily see and explore the health of the entire estate in a highly dense honeycomb view with traffic light colors based on alerts. (Example shows “dark mode” view.)
Curation through context—closing the skills gap
Ultimately, what you should see when you awake after being paged at 3 a.m. is an interface so intuitive and modern that it can serve as every IT, engineering, and SRE team’s daily real-time interface for understanding what’s happening across your entire environment.
Curation through context also helps close the skills gap in a complex digital enterprise. It provides a way for everyone in the organization to visualize the flows and dependencies in their complex systems and to see everything that’s relevant to the entire environment. Because this curation models a variety of systems well, it makes understanding more accessible for people, even when they are not familiar with that specific technology or code.
In other words, you need quick views that anyone in your organization can use to:
- Understand, with rich context, the relationships between your technology, business, and customers.
- Make data-driven decisions that have the biggest direct impact on specific KPIs.
When these views effectively model the technical environment automatically, curated visualizations make it easier for everyone to find root causes. And applying intelligence to large datasets surfaces connections in the data, allowing people to do what they are best at: making nuanced decisions about what to do in a tough situation.
The Benefits of Full-Stack Observability
As software innovation progresses, the world will continue to move faster and get more complex. Just as the latest technologies and tech trends couldn’t have been anticipated just a few years ago, we don’t know what the next big things to come will be. What we do know is that this continuous innovation and complexity will keep ramping up the expectations on your teams to move faster, embrace more technologies, and deliver zero errors at lightning speed. You’ll also have to automate more and keep pace with customer expectations that have been set by other companies—including your competitors—delivering cutting-edge customer experiences.
Given these challenges, you need a full-stack observability platform that reduces complexity and risk, and that does so with low overhead. You need a platform that closes the skills gap by being easy to use, understand, and traverse to gather essential context, so it’s not a barrier to use for any team within an organization. You need one platform that allows your teams to see all of their telemetry and business data in one place, get the context they need to quickly derive meaning and take the right action, and work with the data in ways that are meaningful to you and your business.
Full-Stack Observability will help you
- Reduce mean-time-to-resolution (MTTR)
- Detect and diagnose issues
- Perform chaos engineering and load testing across your systems
- Give your developers more time for innovation
When you have full-stack observability, the benefits to your business are profound:
faster innovation, speedier deploys, less toil, reduced costs, and better understanding of how to prioritize your finite time and attention. Developers should be able to innovate and chaos test with confidence, knowing that the changes they’re making won’t break the system. These are the benefits of full-stack observability.
All of this leads to a much deeper, shared understanding of your data, your systems, and your customers. All of which will improve your culture, and lead to business growth as you gain real-time views into how your digital systems perform and how your customers engage with your software, which lets you focus on what matters most—the business outcomes you are tasked to deliver every day.
To learn about how New Relic provides these essential components of full-stack observability, visit newrelic.com/platform/explorer.

Observability is a lot more than a synonym for monitoring. Monitoring gives software teams instrumentation, collecting data about their systems and allowing them to quickly respond when issues occur.
Observability has become an important practice for modern digital enterprises because no other strategy so effectively enables engineers to deliver excellent customer experiences with software, despite the complexities and distributed nature of their application and infrastructure landscape.
From the experience of the frontend UI to the container resources configured for Kubernetes deployments, the principles of full-stack observability must be applied to your full IT environment to equip software teams to:
- Deliver high-quality software at speed and scale
- Build a sustainable culture of innovation
- Optimise investments in cloud and modern tools
- See the real-time performance of their digital business.
But how do you establish full-stack observability in your environment? And what results can you expect when you achieve it? Download the eBook to learn about three core elements of full-stack observability.


