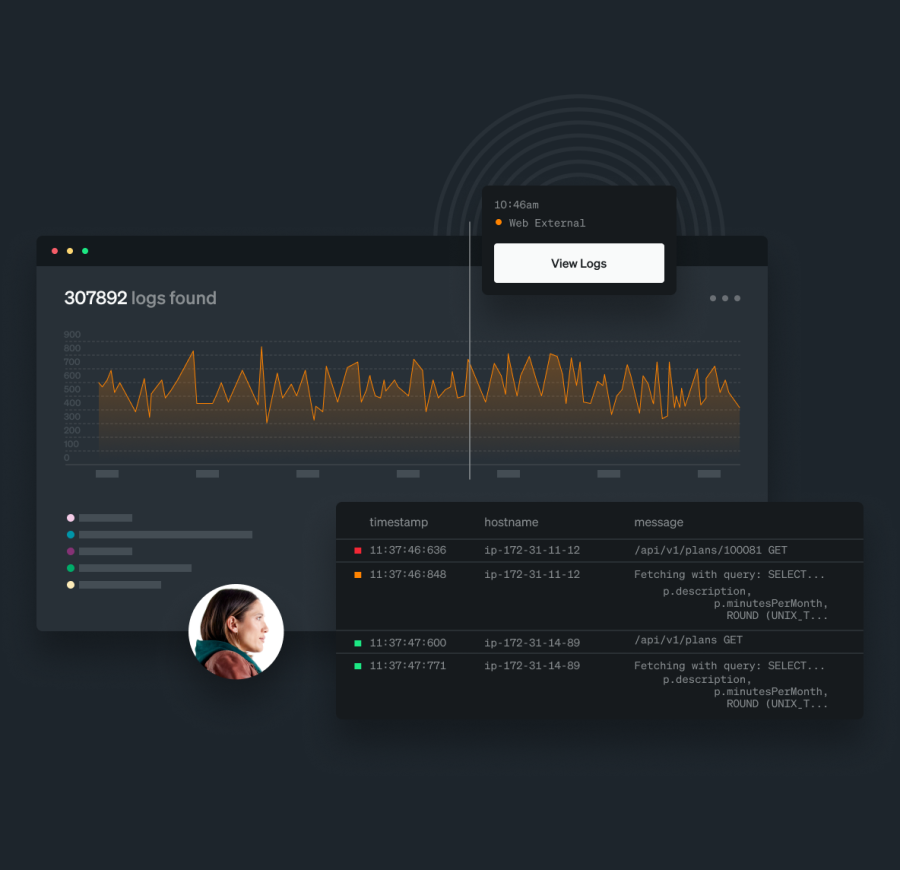
Logs, simplified. Now all in one place.
Fast, trouble-free troubleshooting.
- See curated logs within platform UIs to find problems faster.
- Resolve business-critical incidents using JOINs and lookups with logs and other data in a single query.
- Explore millions of log messages with just a click.
- Instantly detect log patterns and outliers in your log data using machine learning (ML).


Logging solution that you can scale up to keep cost down.
- Low, per-gigabyte pricing at 1/4 to 1/2 the cost of other solutions.
- Automatically scales to the volume you use.
- Includes 30 days of log retention, queries, alerts, AIOps, and dashboards.
- No complex pricing or overage penalties.
Simple to set up and easy to use.
- Easily ingest log data from anywhere using New Relic’s log forwarder.
- Configure APM and infrastructure agents to get in-context logs alongside other telemetry data.
- Use open source tools from Fluentd, Fluent Bit, and Logstash, and integrations with AWS, Azure, and more.
- Go agentless and forward syslog data to New Relic’s TCP endpoint.


Get centralized log management for instant visibility at any volume.
- Get search responses in seconds without the need to index logs.
- Use data partitioning to segment data any way you want.
- Search, filter, or pivot to areas of interest, save searches, and create custom dashboards and alerts to find and fix issues fast.
Get live archives for long-term storage —and pay up to 75% less.
- Analyze historical logs faster to get rapid insights, alongside the rest of your logs.
- Eliminate the need to rehydrate, reload, re-index, or move data to multiple tiers.
- Stop paying for ingress and egress, indexing and reformatting log data, or additional logs tools.
- Store logs for up to seven years in an active, hydrated, and enriched state.

Only pay for what you need,
not a bundle of SKUs.
- Transparent user-based pricing
- 100 GB/month free data
- $0.30 per GB as you grow
- Start now for free
See why customers love New Relic log management.
has us open.
Start New Relic log management fast, and for free.
Get complete, contextualized visibility into all your logs with 100 GB/month ingest free, forever. Then it’s only $0.30 per GB ingested after that.
Log Management FAQs
Log management is the process for handling log data, including generating, aggregating, storing, analyzing, archiving, and disposing of logs. By sending all your log data to a centralized tool, you’ll have an essential log management process that can make it much easier and faster to understand and identify problems in an application network.
- Security monitoring: Use log data to detect and investigate security incidents.
- Incident response: Analyze your logs to investigate and respond to issues and quickly identify the root cause.
- Troubleshooting and debugging: Analyze your logs in order to identify current application errors, bottlenecks, and software bugs.
- Performance monitoring: Monitor system performance by analyzing log data to identify utilization patterns and anomalies that may potentially impact the health and responsiveness of your system.
- Application monitoring: Keep track of application-specific logs in order to gain essential insights into user interactions and performance metrics.
- Business intelligence: Extract key business insights from logs to identify trends and better understand your users and their behaviors.
Monitoring system logs requires a good understanding of the system and the logs that are generated by it. Additionally, it's important to have accurate, real-time data to interpret the logs and take action based on everything that happens in your application, network, or server.
New Relic log management can help you monitor system logs quickly, easily, and all in one place. Reduce your workload by having all of your system logs correlated to curated content across your entire stack with real-time monitoring and in-depth troubleshooting.
New Relic’s logging best practices include:
• Anticipate common scenarios.
• Log meaningful messages for valuable context.
• Keep logs simple and concise to capture only the most critical information.
• Don’t forget to timestamp.
• Use a log format with consistent structure for meaningful parsing.
You should consider shifting from your ELK (Elasticsearch, Logstash, and Kibana) stack when your software engineering teams need to share insights with less-technical business and customer-facing teams. Plus, New Relic’s tools are easy to learn, making them ideal for your growing developer team. Read more about Simply Business’s shift from ELK to New Relic.


