Application Monitoring

Discover true application monitoring: New Relic APM 360.
Go from incident response to proactive application monitoring.


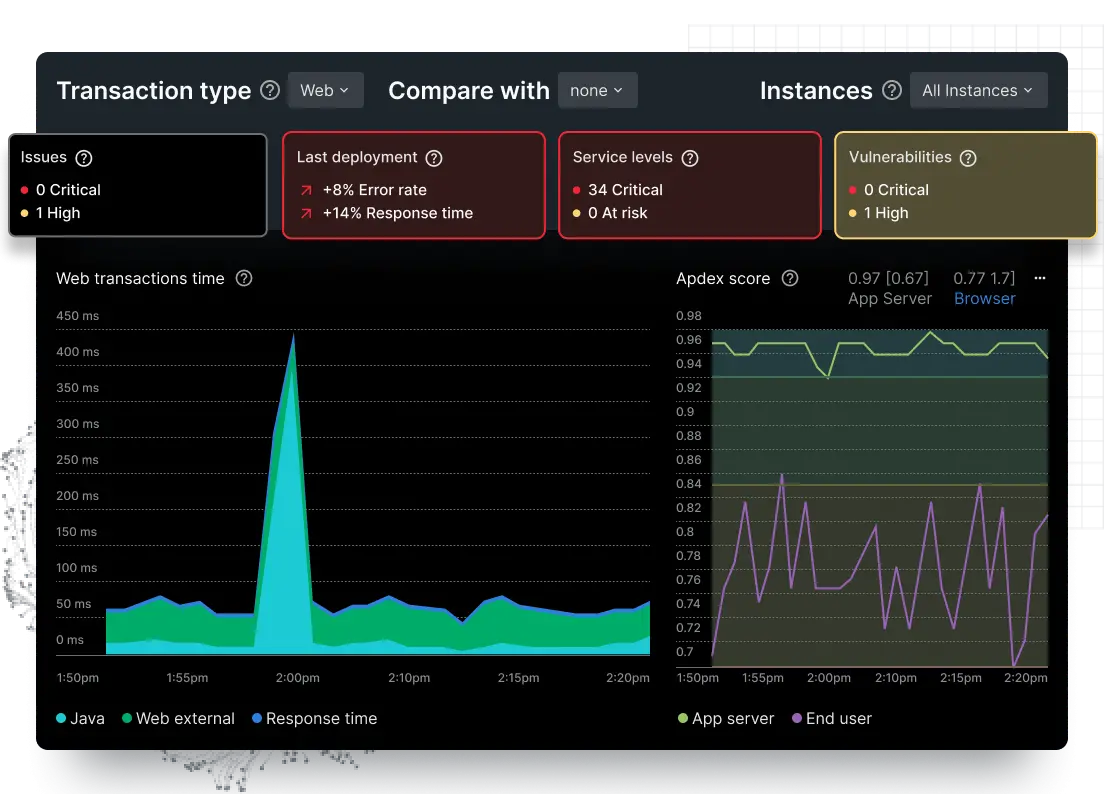
See application health at a glance.
- Instantly monitor golden metrics, visualize dependencies, and spot issues with alerts and error tracking.
- See user experience in the APM interface with key transactions, synthetic checks, and browser monitoring.
- Monitor SLOs and business KPIs in real time to spot issues before they impact users or your business.

Share insights across application lifecycle.
- Easily track impact of deployment and changes on application performance.
- Gain instant visibility into all application vulnerabilities with no additional configuration.
- Improve team efficiency and process by bringing telemetry to engineers in their IDE with CodeStream.
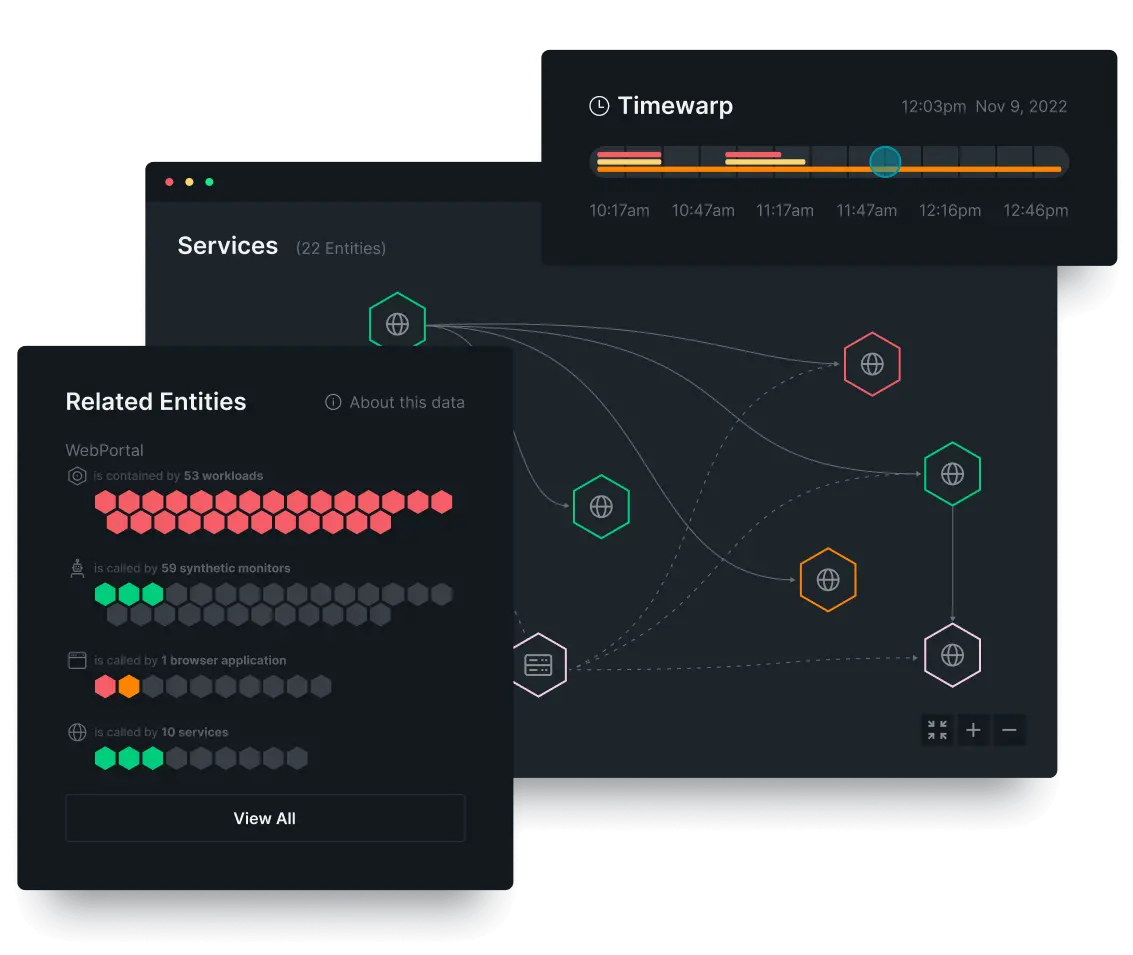
Debug faster with a unified view of stack.
- View infrastructure metrics within APM to quickly detect root causes.
- Get instant insights with error user impact view and log patterns.
- Untangle complexity by using distributed tracing to visualize the path of any service request.

Increase visibility, decrease costs.
- See everything across your entire stack to quickly discover and fix issues before customers notice.
- Quickly spot missing alerts, SLOs, and vulnerabilities for less risk of undetected issues.
- Save costs by ditching multiple tools for the all-in-one observability platform.
Instrument instantly with automatic agents or OpenTelemetry.
- Choose from 750+ integrations, including automatic instrumentation.
- Ingest your way—with New Relic agents or full OpenTelemetry support.
- Instrument everything on one platform to observe all your data in one connected experience.

Customer Stories


30+ capabilities. One platform.
One price.
Application Performance Monitoring FAQs
APM stands for "application performance monitoring." It's a set of tools and processes used to monitor and optimize the performance of software applications. APM systems can track various metrics, such as response times, resource usage, and error rates. This provides insights into how to improve the performance of an application.
The aim is to help organizations detect anomalies, reduce latency, and optimize the customer experience. APM can also be used to detect and diagnose problems, such as bottlenecks or bugs, that may be impacting the performance of an application.
There are several ways to assess the performance of an application. APM strategies and tools alert your dev teams of errors and issues before customers experience them.
With APM software, you can assess your application’s performance from one dashboard. Here are the most common assessment methods:
1. Monitoring: Collect data on various performance metrics, such as response times, resource usage, and error rates, and then analyze that data to identify trends and potential issues.
2. Load testing: Simulate real-world usage scenarios, such as a large number of users accessing the application at the same time, to see how the application performs under stress.
3. Performance profiling: Analyze the application's code to identify bottlenecks or areas that could be optimized for better performance.
4. User feedback: Collect feedback from users about their experiences using the application, including any issues they may have encountered.
5. A/B testing: Compare two versions of an application to see which one performs better.
6. Synthetic monitoring: Monitor an application's performance by simulating user interactions with the application in a controlled environment.
There are several key metrics that you should monitor when using APM tools:
1. Response time: How long it takes for a request to be processed and a response to be returned.
2. Error rate: The number of errors that occur in the application, such as failed requests or unhandled exceptions.
3. Resource usage: The amount of system resources, such as CPU and memory, that the application is using.
4. Throughput: The number of requests that the application can handle within a certain time period.
5. Latency: The time it takes for data to travel from the client to the server and back.
6. User experience: The overall satisfaction of the users with the application.
7. Business metric: The impact the application has on the business, such as the number of transactions, revenue, conversion rate, etc.
It's important to monitor these metrics over time to detect trends and patterns, and to be able to identify when and where performance issues occur in the application.
Also, it's important to note that depending on the specific requirements of your application, you may need to monitor additional or different metrics.
Zero-day vulnerabilities are previously unknown risks that can allow threat actors to exploit production applications and services for data theft, extortion, or disruption of your business.
To continuously assess application risks, use New Relic Vulnerability Management to identify and prioritize vulnerabilities by application or service, and then test if these vulnerabilities are actually exploitable using New Relic interactive application security testing (IAST).
- Vulnerability assessment: Monitor open source libraries within applications and services for common vulnerability exposures (CVEs).
- Impact analysis: Filter vulnerabilities by severity, count, scope, source, and steps to remediation in order to prioritize efforts.
- Vulnerability surface area audit: Monitor the vulnerability of all your entities, libraries, number of services using a vulnerable library, active vulnerabilities, and when they were first and last seen.
- Proof of exploit testing: Simulate a real-world attack to test if an application’s vulnerabilities are actually exploitable by a threat actor.
There are several benefits to using APM software.
1. Your users will have a better experience. By monitoring the performance of an application, APM software can provide insights into how to improve the user experience. This can help organizations ensure their applications are running smoothly and providing a good user experience.
2. Your app will have increased reliability. APM software can detect and diagnose problems, such as slow response times or high error rates, that may be impacting the reliability of an application. By addressing these issues, the reliability of the application can be increased.
3. APM software can save money by helping organizations identify and address performance issues before they cause major problems, such as system downtime or lost revenue.
4. You can create better business performance. APM software can provide detailed information on how the application is impacting the business, such as the number of transactions, revenue, conversion rate, and other key business metrics. This information can be used to optimize the application and improve the overall business performance.
APM software can help organizations ensure that their applications are running smoothly, providing a good user experience, and impacting the business positively.
There are several ways to monitor application performance in production. Application performance in production combines several factors, including:
1. Browser monitoring: Collect data on the performance of the application as it's being used by actual users. This can be done by using JavaScript tags that are embedded in the application's code to collect data on the client side, or by using proxy servers to collect data on the server side.
2. Synthetic monitoring: Simulate user interactions with the application in a controlled environment, such as a test server, to measure performance.
3. Log analysis: Analyze log files generated by the application to identify performance issues, such as slow response times or high error rates.
4. Application instrumentation: Add code to the application to collect data on performance metrics, such as response times and resource usage, that can be used for monitoring.
5. Infrastructure monitoring: Collect data on the performance of the underlying infrastructure, such as servers and network devices, that the application is running on.
6. Third-party tools: There are several third-party tools that can be used for monitoring application performance in production, such as APM tools.
APM software can help monitor all of these factors in one dashboard so you don’t have to run various different tests to get a holistic view of the app environment.
There are several ways to measure application performance:
1. Response time: How long it takes for a request to be processed and a response to be returned. It's typically measured in milliseconds.
2. Error rate: The number of errors that occur in the application, such as failed requests or unhandled exceptions. It's typically measured as a percentage of total requests.
3. Resource usage: The amount of system resources, such as CPU and memory, that the application is using. It's typically measured in bytes or percentages.
4. Throughput: The number of requests that the application can handle within a certain time period. It's typically measured in requests per second or transactions per minute.
5. Latency: The time it takes for data to travel from the client to the server and back. It's typically measured in milliseconds.
6. User experience: The overall satisfaction of the users with the application. It can be measured through surveys, user feedback, and other user-centered metrics.
Your IT and DevOps teams can measure app performance by using data gathered on abnormalities and performance issues. This data is easily rendered in APM software that's already monitoring performance factors like this. Using this data, you can comprehend trends, optimize resource use, and resolve performance issues before they impact end users.