What's included?
You can edit this quickstart to add helpful components. View the repository and open a pull request.
HCP Consul
HCP (Hashicorp Cloud Platform) Consul is a version of Consul in which the control plane is managed by HashiCorp Cloud Platform.
HCP Consul is a service mesh and service discovery solution provided by Hashicorp. It enables platform operators to quickly deploy a fully managed, secure-by-default service mesh, helping developers discover and securely connect any application on any runtime, including Kubernetes, Nomad, and Amazon ECS.
Monitor HCP Consul metrics with New Relic
Keeping your Consul and Nomad clusters healthy can help with optimizing SQL query times, troubleshooting slow HTTP response times, and real-time alerting on down-time for your Hashicorp clusters. Monitoring your Hashicorp cluster metrics is pivotal for keeping your Hashicorp mesh services operating at full capacity.
New Relic supports monitoring of HCP Consul and Envoy metrics through the StatsD plugin integration. The StatsD plugin aggregates all the metrics exposed by HCP Consul and pushes them to New Relic for data visualization and alerting.
HCP Consul quickstart highlights
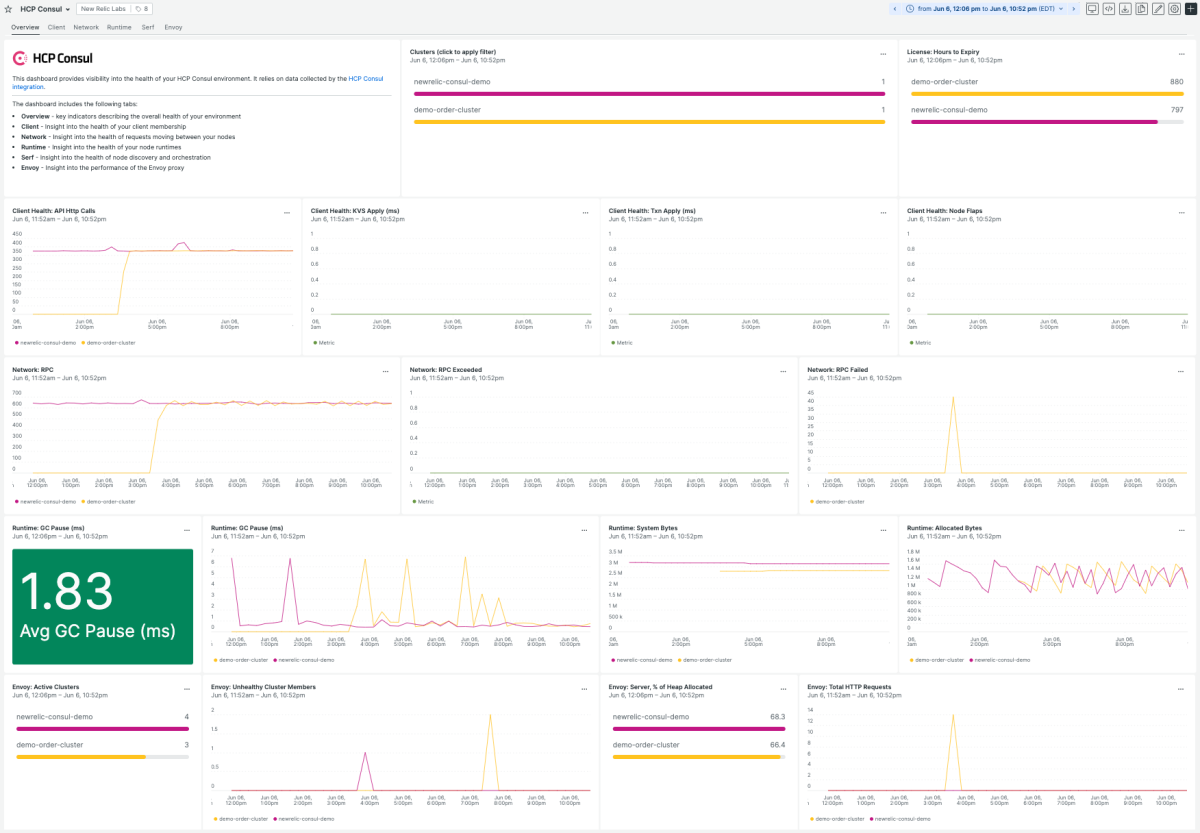
The HCP Consul quickstart for New Relic provides a pre-made dashboard with HCP Consul and Envoy metrics to get started easily. This dashboard provides visibility into the health of your HCP Consul environment with 6 tabs:
- Overview: key indicators describing the overall health of your HCP Consul environment
- Client: Insight into the health of your client members, such as API HTTP calls, cache, nodes, and messages
- Network: Indicators on network health including metrics for RPC, TCP, UDP, and gRCP
- Runtime: Node runtime health metrics for garbage collection, heap size and allocation, and Go routines
- Serf: Node discover and orchestration
- Envoy: Proxy health, cluster membership health, and network traffic performance

