WHAT IS SERVERLESS MONITORING?
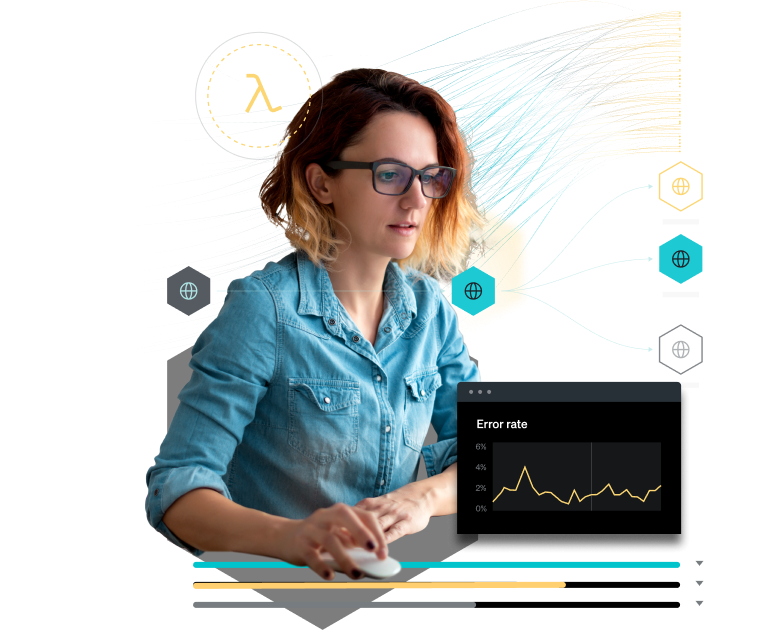
Observability into all your cloud-managed functions.
Simplify your serverless computing.
- Monitor, troubleshoot, and alert on all your serverless functions and take action in real time.
- See correlated performance of serverless functions across your stack in a single view.
- Quickly and easily highlight issues with a high-cardinality view of all requests and services.


Find and fix problems before they impact users.
- Know and correlate every request’s journey through the code and dependent services.
- Get automatic, immediate alerts and insights into serverless functions.
- Find the root cause fast with code-level request and error details in the context of the end user.
Work faster in any cloud.
- Automatically track all functions, whether your serverless applications run on AWS, Azure, or GCP.
- Streamline your serverless process with no-code instrumentation.
- Simplify monitoring of your Lambda functions with our easy Lambda layer onboarding tool.

Ready to start monitoring quickly?
Our instant integrations for cloud services, tools, and services make it easy.
Look who
has us open.
has us open.
1


