WHAT IS KUBERNETES MONITORING?
New Relic connects Kubernetes, applications, and all telemetry across the stack for faster incident resolution.


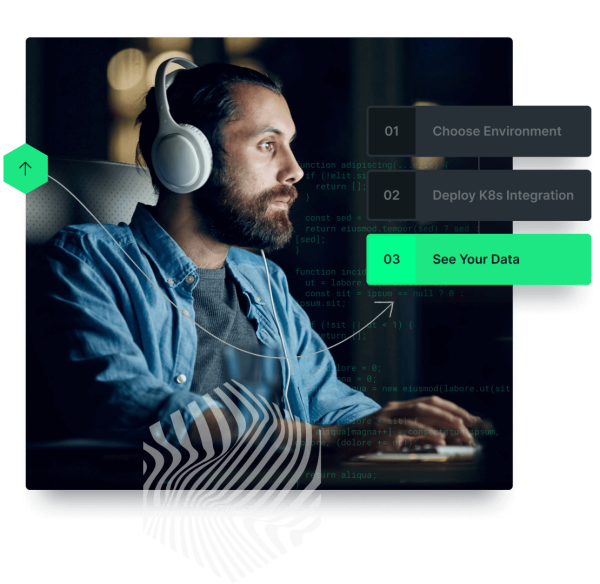
ONE-STEP KUBERNETES
Get started quickly with automatic instrumentation.
- Get Kubernetes observability quickly and easily with our simple, guided install.
- Streamline APM and Kubernetes monitoring with APM auto-attach, enabling automatic APM instrumentation together with Kubernetes deployments without requiring any code modifications.
- Have instant, no-code (language agnostic) observability using eBPF.
- Get insights immediately with out-of-the-box alerting for nodes and pods.
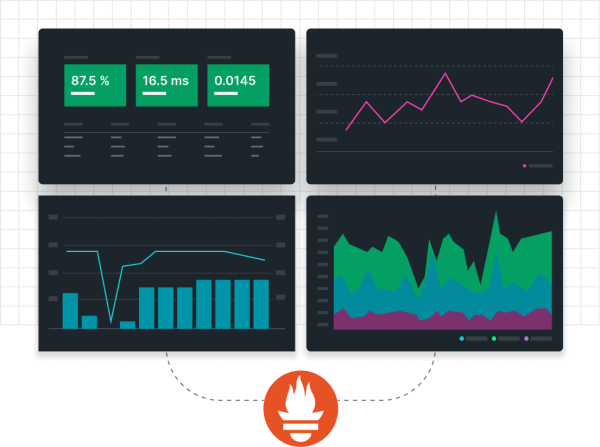
SIMPLIFY OPEN SOURCE
View OpenTelemetry and Prometheus insights on a native UI.
- Get started quickly with one-step instrumentation for OTel-instrumented Kubernetes clusters and Prometheus-instrumented workloads.
- Identify issues faster with out-of-the-box dashboards and native UIs with standardized golden metrics.
- Faster debugging enabled by automatic relationship mapping and correlation with application and infrastructure logs.
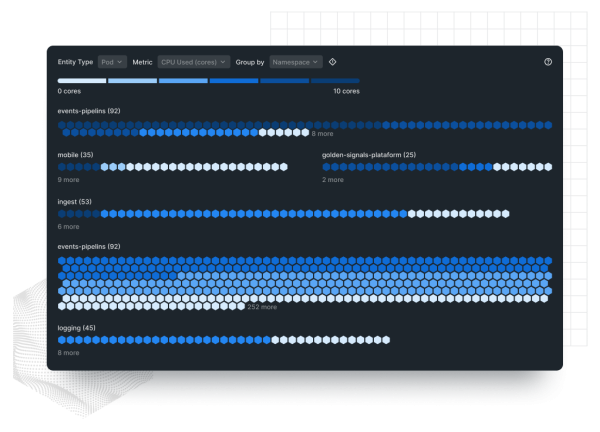
SINGLE SOURCE OF TRUTH
Multiple Kubernetes clusters. One pane of glass.
- See everything in your clusters, from apps to infrastructure, with platform-wide observability.
- Quickly diagnose cluster problems such as OOMKilled errors, failed image pulls, and crash loops.
- Understand resource health with color-coded UIs and preconfigured alerting policies.
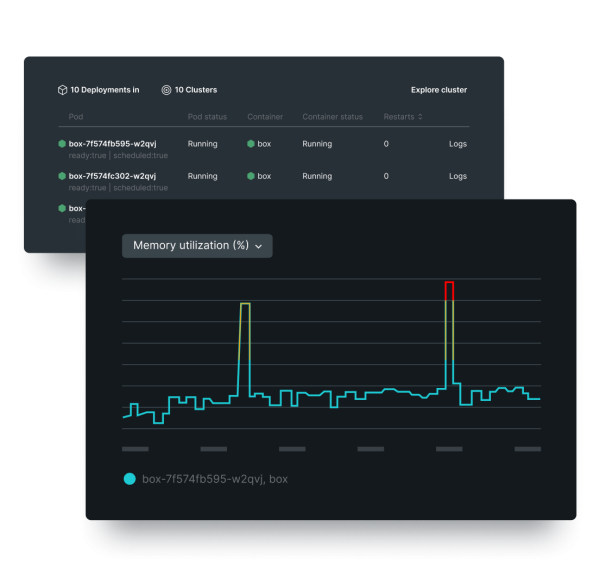
FASTER INSIGHTS
Quickly find the root cause of performance issues.
- Understand how your Kubernetes pods, nodes, containers, and applications impact each other.
- Analyze workload performance across all your clusters in a single, curated UI.
- Get real-time alerts with an activity stream for K8s events and critical issues.
NO-CODE INSTRUMENTATION
No-code instrumentation with eAPM.
- Deploy a single eBPF agent to automatically discover, instrument, and monitor application performance within Kubernetes clusters without any code changes.
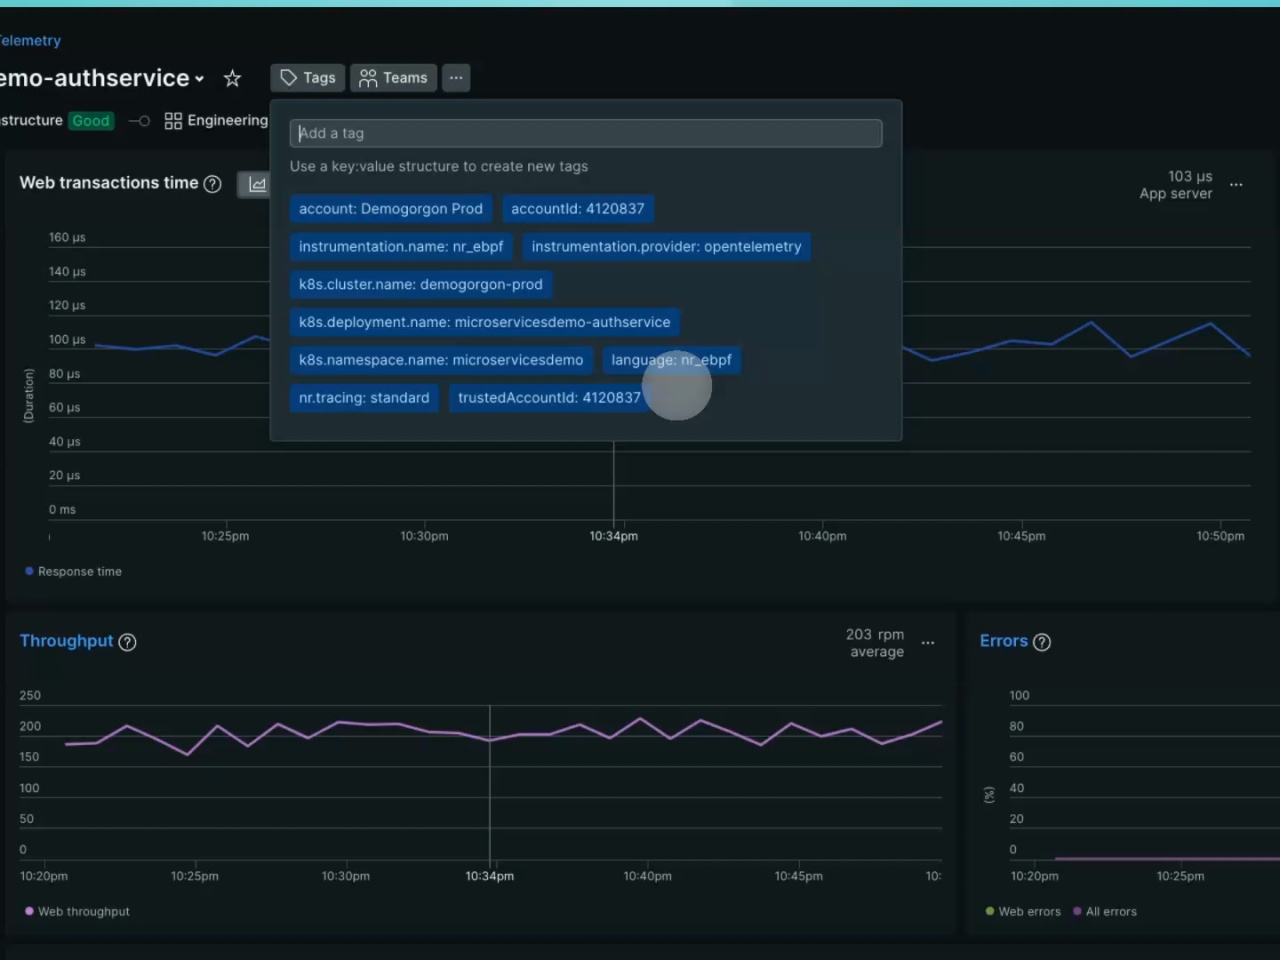
- Monitor all golden metrics, transaction details, database performance, and more in New Relic’s APM UI.
- Identify critical span issues easily with intelligent span sampling, making it simpler to solve performance-impacting issues.
- Switch from eAPM to APM agents to get deeper insights without any gaps in the APM UI, eliminating the need to re-create custom dashboards and alerts.