
WHAT IS BROWSER MONITORING?
The easy way to track real-user patterns and changes in page performance.


Spot and solve frontend issues before they affect your business.
- Automatically collect and correlate user interactions and frustration signals with instant engagement insights—no instrumentation needed.
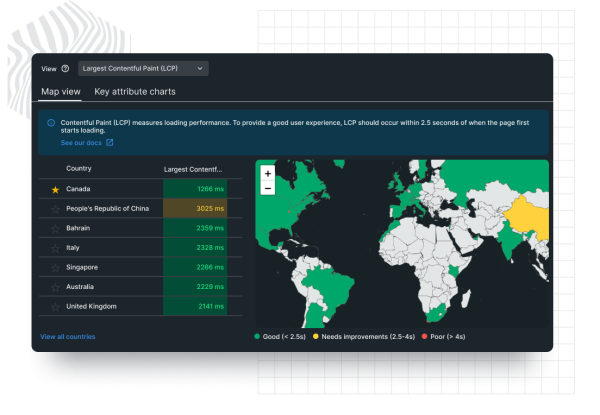
- Identify and improve pages with underperforming core web vitals that may affect your site's SEO.
- Use distributed tracing to connect browser incidents to backend code—and fix them fast.
- Make every deployment successful by enhancing real-time browser data with synthetic tests.
- Identify specific points of friction with advanced filtering options that enable granular exploration of session data.
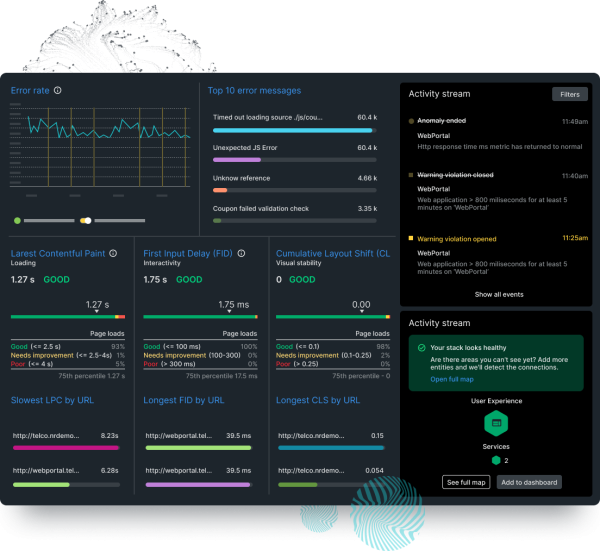
Enhance performance metrics based on user perception.
- Precisely measure user engagement by filtering by geography and type of device.
- See exactly how faster page speeds reduce bounce rate to boost customer satisfaction.
- Set targeted alerts for key performance indicators so you can react in real time.
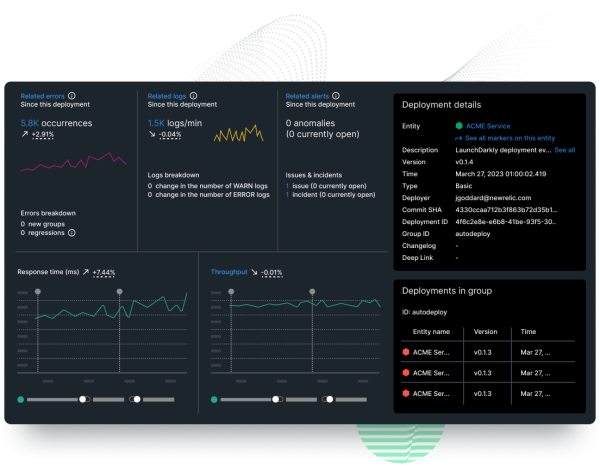
Track changes in error rates to keep new deploys on track.
- Use deployment markers to easily benchmark web page performance.
- Visualize changes in vital web performance with line graphs in the deployment dashboard.
- Keep an eye on sudden drops in application performance to quickly roll back code if needed.
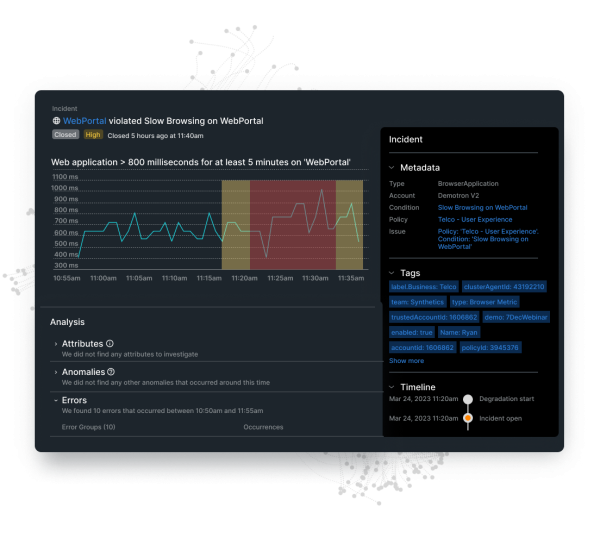
Filter, find, and fix code-level errors in record time.
- Refine web performance by browser type, page views, and other key factors.
- Keep errors from recurring with access to granular error data to reproduce issues locally.
- Quickly troubleshoot backend services that affect users by comparing source maps and stack traces.
- Collect console logs at the flip of a switch and access them in actionable context for faster debugging.

Ready to start quickly?
Start monitoring your browser in a few clicks with New Relic Instant Observability quickstarts.